At our recent autocon/22 event, we announced our partnership with Datadog. By working together with Datadog, Sedai enables Datadog customers to have an autonomous cloud engine in as little as 10 minutes.
Datadog is an observability platform of choice for many looking to visualize their cloud environments and trace applications. Together with Sedai, cloud teams can maximizing cost savings and optimizing application performance autonomously. Sedai streamlines cloud operations and increases efficiency by eliminating day-to-day toil while achieving guaranteed optimal results.
Datadog provides performance metrics and deep insights of applications into Sedai through the integration with Datadog’s APM engine. In turn, Sedai uses its AI/ML algorithms to intelligently learn the seasonality of applications to uncover improvement opportunities and autonomously execute optimizations and remediate issues. Autonomous actions taken by Sedai are visible right inside the Datadog dashboard, enabling teams to continue using Datadog as the primary monitoring tool.
Why Datadog users should go autonomous
Most Datadog users use manual or semi-automated approaches
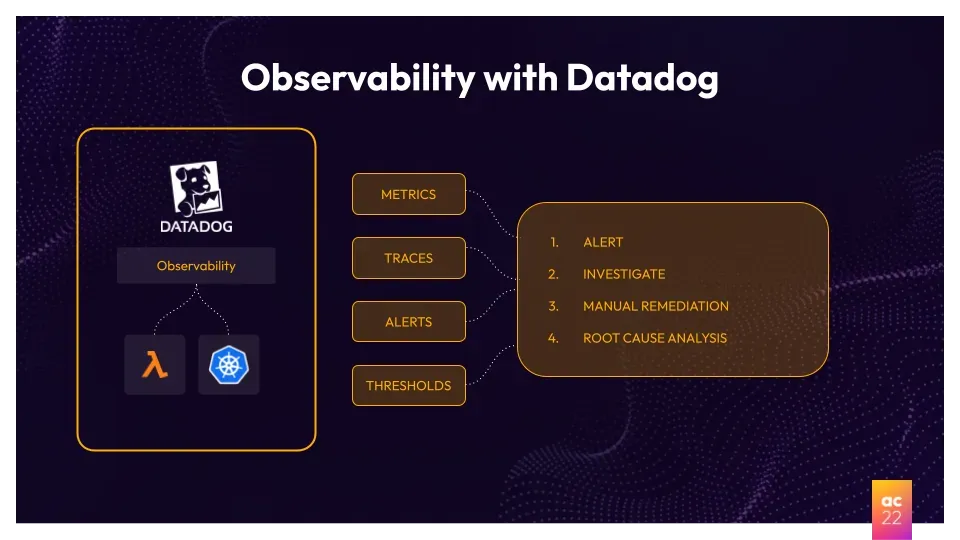
Today, the typical Datadog customer will have a manual or automated approach to resolve issues identified by Datadog. In a manual remediation cycle, a SRE DevOps engineer or developer will establish threshold alerts in Datadog such as, “Alert me if an application consumes more than 70% of resources available.” Once the alert is triggered, the SRE will be notified and he/she will investigate and conduct a horizontal or vertical scaling based on the issue at hand. The SRE will also monitor the issue to ensure that is resolved.
When using Datadog, many SRE teams will use scripts to automate actions from alerts. If we take the previous example of an application utilizing 70% of available resources, an SRE team can write a script that works with the VPA or HPA in Kubernetes to conduct a scaleup and define the threshold for scaling to prevent resource wastage.
Challenges in remediating performance and cost issues at scale
While this workflow automation saves time relative to a manual approach, it also complicates things in the long term. As businesses grow, their environments and the number of alerts grow with them. With hundreds, if not thousands of alerts all having individual thresholds and number of scripts, the different scaleup thresholds also increases. Although automated with the goal of saving time, the complexity of such environments can complicate the lives of SRE teams.
What if the environment changes over time? What if the traffic patterns have seasonality components to them? Are we over-allocating resources? Where can we cut costs without negatively impacting performance? Are there possible availability issues due to unforeseen bursts in traffic?
All these are concerns that many SRE teams often find it difficult to address without adding significant resources as their companies scale. And, if left unaddressed, can lead to serious issues. Luckily, with Sedai, all of them can be resolved efficiently, accurately, and autonomously.
Benefits of shifting to autonomous management
Manual and automated remediation in DataDog still requires an SRE to set up all alerts, thresholds, and perform a QBR to ensure performance is at the right level based on how the environment changes over time. In contrast, autonomous systems like Sedai continuously learn the seasonality and behavior of your environment, while determining what resources are needed, when and how much, and opportunities to scale back – all in real time, all autonomously with no human or manual intervention.
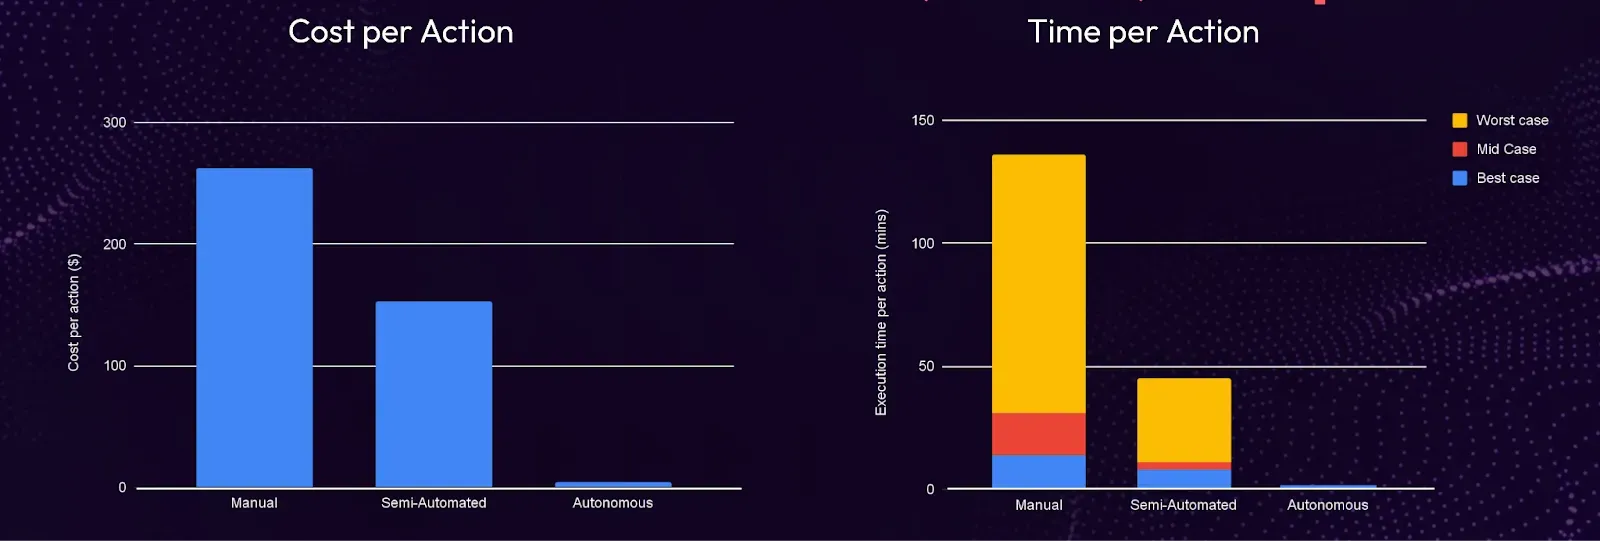
Autonomous operations deliver both faster speed and lower cost. For a recent Sedai user we calculated the impact of running manually, semi-automated and autonomously. There was a 50-100x difference in cost and speed to complete given actions (see chart below).
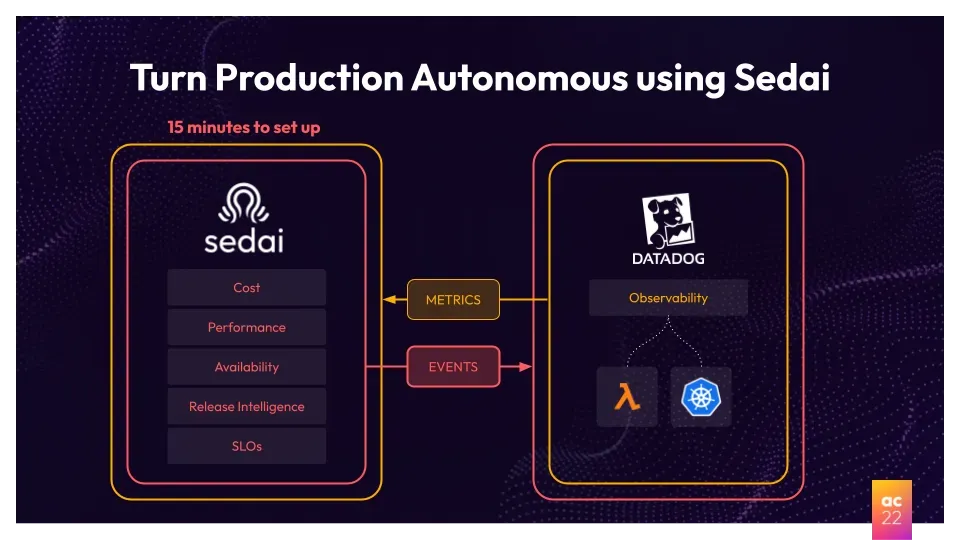
How Sedai works with Datadog
Sedai works seamlessly with Datadog and activation takes just 10-15 minutes – no alerts, no thresholds, and no manual setup. Sedai layers on top of your Datadog instance and ingests metrics and insights from the platform. Using ML, Sedai learns your specific application’s behavior, seasonality, resource configurations, and an array of other parameters. After Sedai’s algorithms learn about your application, Sedai will then begin to take autonomous action in your environment and execute on your behalf. Those actions can then be fed back into the DataDog platform as events. Changes can then be tracked and visualized in real time, right on the DataDog dashboard.
Seeing autonomous actions inside Datadog
Datadog users tell us what helps them the most is the ability to correlate changes in metric performance with Sedai autonomous actions right inside Datadog. The Sedai integration provides an out of the box dashboard showing a series of events reflecting Sedai taking autonomous action and their impact.
In the example screen below we are inside Datadog looking at the Sedai dashboard and seeing an example of a series of autonomous actions Sedai took to improve performance. We are in calendar view, and we can look back over this April-June period and see:
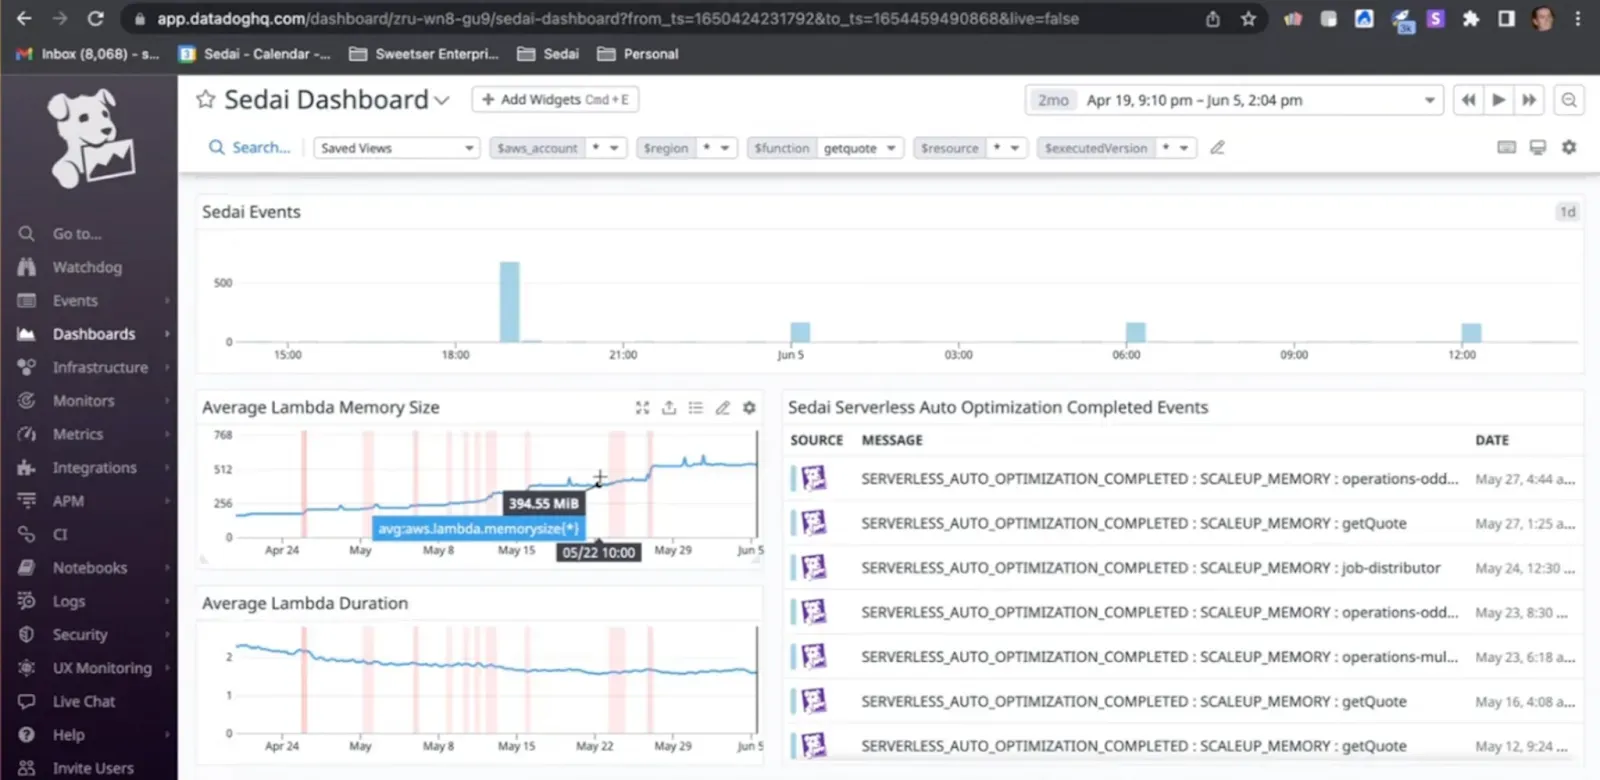
In this case, they are a series of memory scaleups for individual Lambda functions, a common tactic Sedai’s AI deploys to improve performance. The summary metrics in the bottom left portion of the screen shows the changes and results from these actions. You can also see the average Lambda memory size across all serverless functions have increased over time, which is the driver for the reduction in average Lambda duration (the performance gain). The panel offers a convenient way for Datadog users to monitor actions taken.
Autonomous use cases for Datadog Users
Increase application performance and availability
When talking about performance, Sedai can detect a traffic burst and autonomously scale your systems to accommodate the increase in traffic. This helps to ensure the application is performant and your customer experience is not affected. We also continuously monitor and learn from our actions to optimize for continued application performance. Additionally, when approaching OOM (out of memory) errors, CPU limits, or timeouts, Sedai can autonomously adjust your applications to avoid such issues.
Optimize cost savings
Inversely, on the cost side, how does Sedai scale resources back down to manage costs without impact on performance? Using ML algorithms, Sedai intelligently determines your resources parameters to deliver required performance at minimum cost.
Establish and meet SLAs
Sedai also helps teams and organizations autonomously establish service level objectives across all applications. Sedai can look at the behavior of applications over time to determine and allocate a service level objective suitable for that application. And wherever possible, Sedai will take action in production to keep you within your error budgets as well.
Release Intelligence
Additionally, we are also able to analyze releases into production on your behalf and create alerts or take action. If an application errors out, times out, or is going to have any performance degradation in the future, Sedai will alert your developers in real time before it gets into production. Alternatively, if your release is pushed into production, we'll send an alert warning if there is an imminent issue forthcoming. If there is a fix Sedai can conduct to resolve the issue, we’ll take that action on your behalf.
Datadog user fabric used Sedai to reduce latency by 48% and improve their customers/SRE ratio by 6.7x; you can read about their story here. To get more information at a technology level please check out our Kubernetes and Serverless solution information.
Get started with Sedai and Datadog
There are three steps to go autonomous with Datadog and Sedai.
Step 1: Schedule a Sedai demo
We'll set everything up for you! You can schedule your personalized Sedai demo →
During the onboarding steps, select Datadog as your monitoring provider using your Datadog API key. This will enable Sedai to access your Datadog metrics.
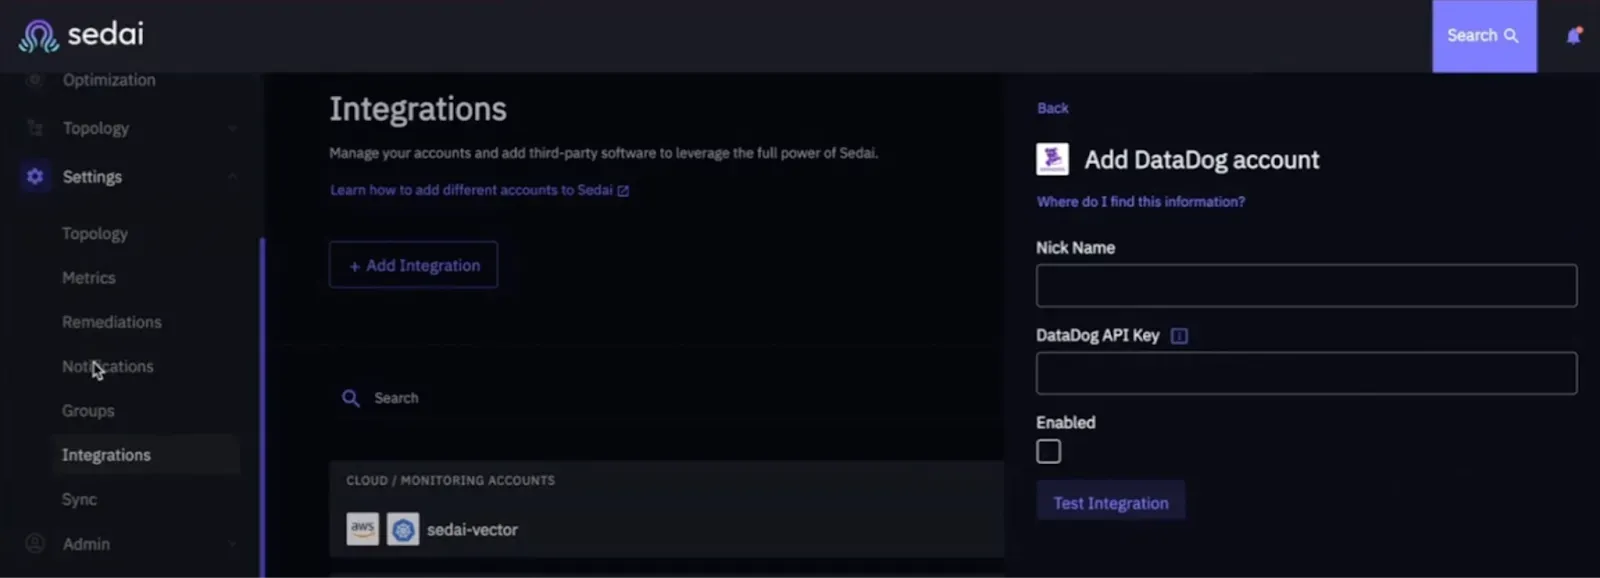
Step 2: Enable events to be sent to Datadog
Inside Sedai, add the Datadog notifications integration and choose the events you want to see in Datadog e.g., serverless optimizations:

Step 3: Add Sedai integration
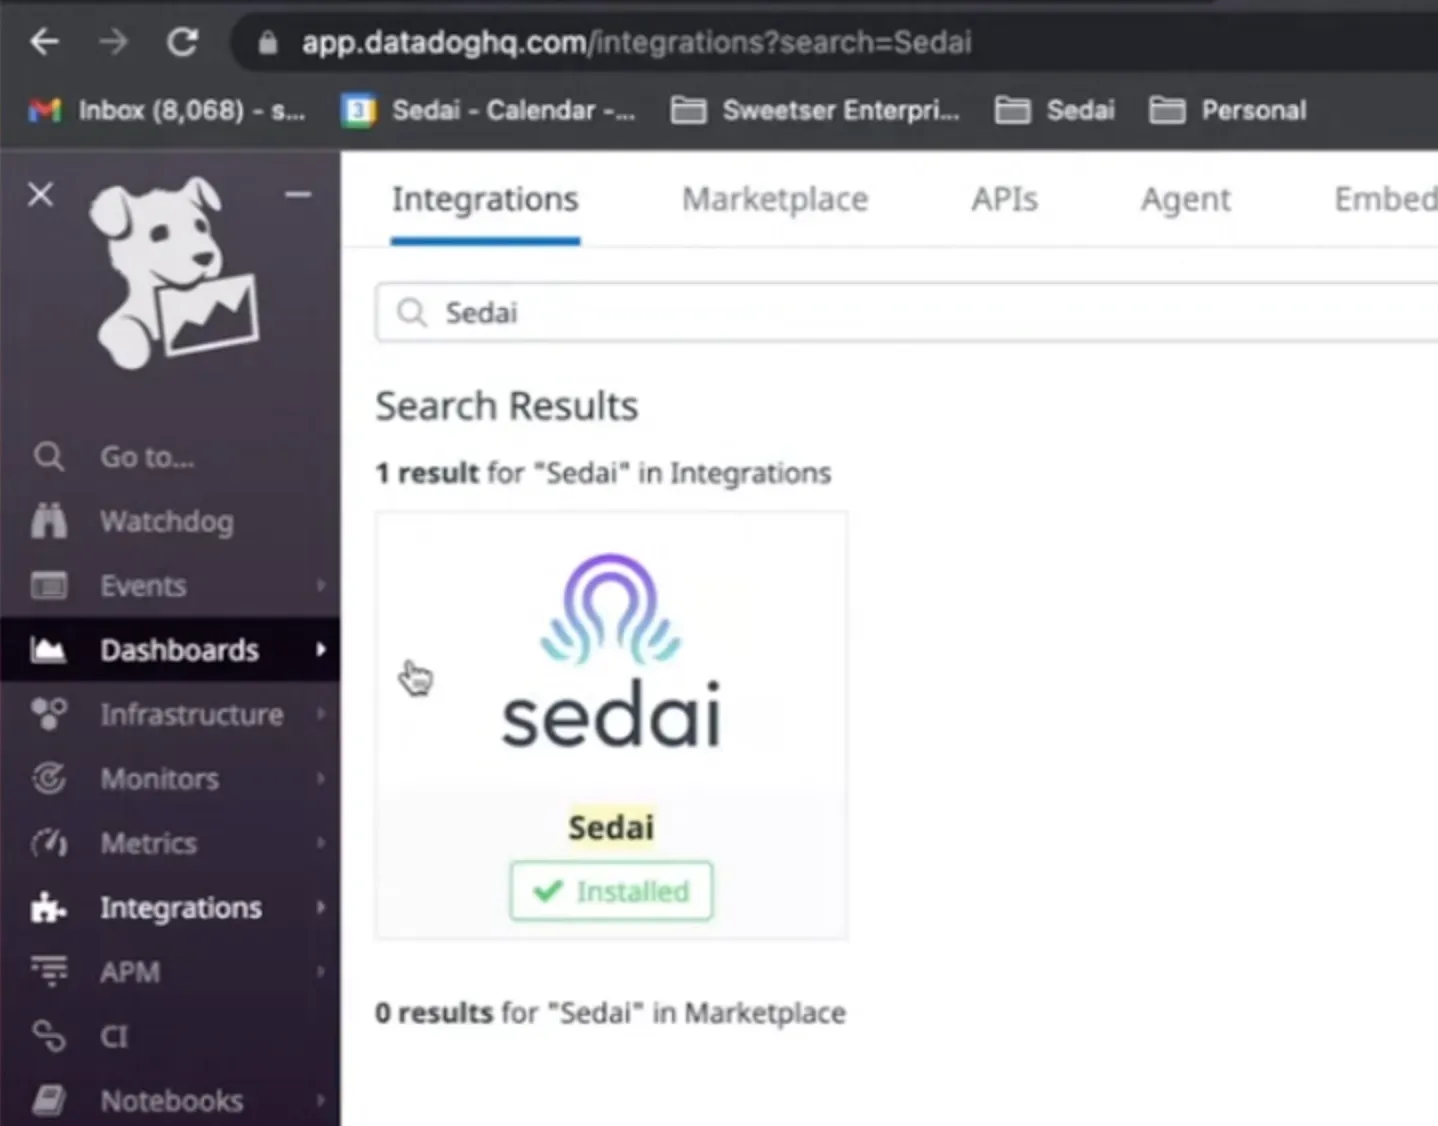
Inside Datadog, you can add Sedai by searching for it under integrations on Datadog’s marketplace or access it directly here. For more details on the integration, access our documentation.
This integration will enable an out-of-the-box dashboard to be created to visualize the changes Sedai is making in your environment in real time.
If you need help or have feedback, you can reach out to us directly or join the conversation in our Slack community.
Conclusion
Sedai’s autonomous cloud platform provides significant benefits for SRE and DevOps teams in scaling and innovating in the cloud for performance, availability, and cost savings. While DataDog provides APM and is an observability solution of choice, Sedai works with Datadog to turn those metrics, data and insights into an autonomous system by taking over the day-to-day toil of SRE and DevOps teams. SRE and DevOps can focus more on innovation while Sedai manages the day-to-day operations of application availability, performance and cost management.
Special thanks to the Datadog team and Monica Cortazar, Partnership Manager at Datradog for their partnership and co-presenting with us at autocon/22.
