AWS Elasticsearch Service powers fast, scalable search, but clusters crash if shards misbehave, queries slow down, or throttling kicks in. This guide teaches you to fix red/yellow statuses, avoid 429 errors, and optimize mappings for speed. Sedai’s cloud automation can help you side by side by automating these fixes and cutting costs while keeping your cluster healthy.
If you’ve faced cluster crashes, sluggish queries, or downtime, you know how fast things can unravel. Managed well, AWS Elasticsearch delivers powerful search and analytics without the pain of manual infrastructure work.
This guide covers everything you need to run it like a pro, from core features and use cases to cost optimization, security, and common pitfalls. You’ll also see how automation tools like Sedai can handle tuning, scaling, and troubleshooting.
Understanding Amazon ElasticSearch Service
Amazon Elasticsearch Service (now Amazon OpenSearch Service) is a fully managed search and analytics engine that makes it simple to deploy, operate, and scale clusters in the AWS cloud. It’s designed for use cases like log analytics, full-text search, and real-time application monitoring, without the need to manage infrastructure yourself.
AWS takes care of scaling, patching, backups, and security, so you can focus on extracting insights from your data. It also integrates natively with AWS services like Kinesis for real-time ingestion, Lambda for serverless processing, and CloudWatch for monitoring, making it a strong choice for cloud-native applications.
By removing the complexity of self-managed clusters, AWS Elasticsearch helps you get to value faster, while still allowing fine-grained control over performance and cost.
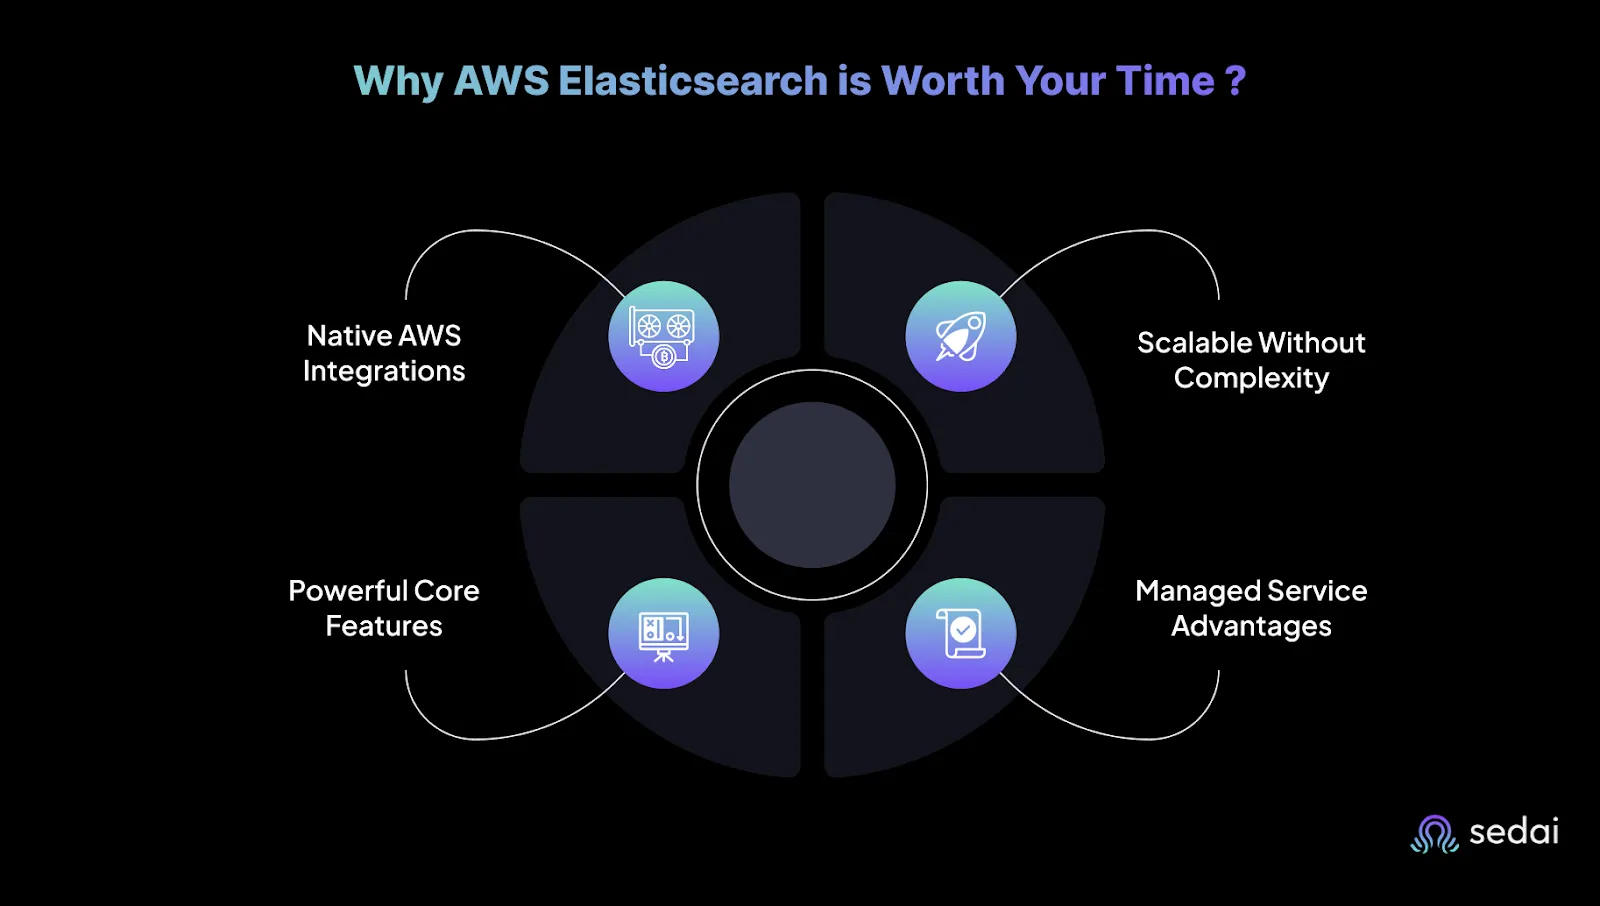
Why AWS Elasticsearch is Worth Your Time

AWS Elasticsearch combines the flexibility of open‑source Elasticsearch with the convenience of a fully managed AWS service. Here’s what makes it valuable for both beginners and experienced teams:
1. Scalable Without Complexity
Whether you’re processing a few gigabytes or terabytes of data, AWS automatically handles scaling. You don’t have to manage sharding, node provisioning, or failure recovery manually simply scale up or down as your workload changes.
2. Managed Service Advantages
Security patches, backups, and high‑availability configurations are built in. AWS manages cluster health behind the scenes, freeing you to focus on data analysis instead of infrastructure.
3. Powerful Core Features
- Managed Clusters: AWS provisions, patches, and recovers nodes automatically.
- Automated Backups: Point‑in‑time recovery (PITR) and snapshots to S3 protect your data.
- Built‑in Kibana Dashboards: Visualize and query data without extra setup.
4. Native AWS Integrations
AWS Elasticsearch works seamlessly with:
- Kinesis: Stream real‑time data directly into your cluster.
- Lambda: Process and transform data before indexing.
- CloudWatch: Monitor metrics and forward logs for deeper analysis.
These features let you start small, scale confidently, and integrate search and analytics into broader AWS‑based workflows without complex setup.
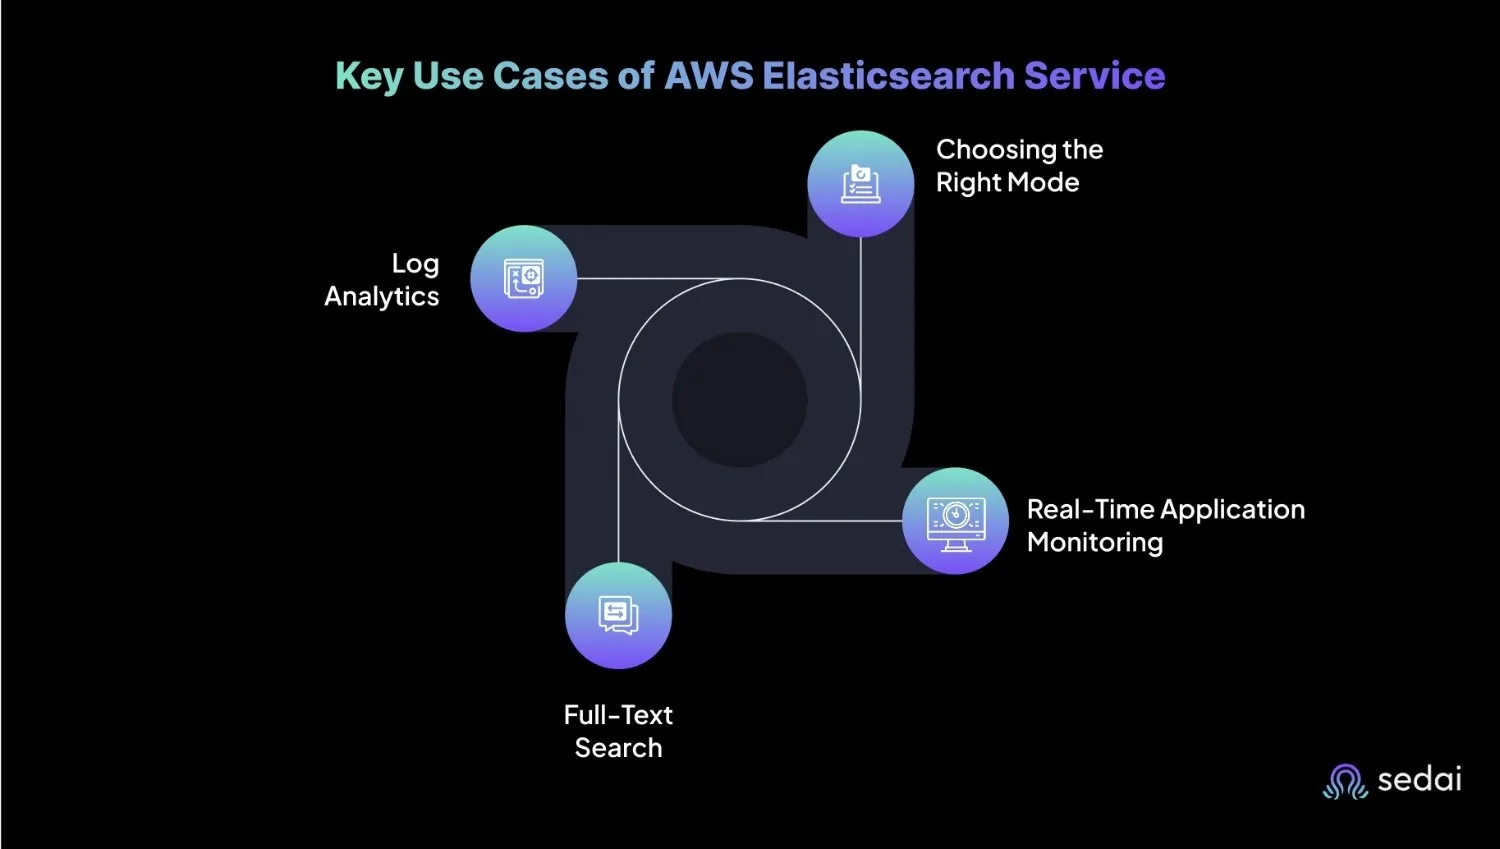
Key Use Cases of AWS Elasticsearch Service

AWS Elasticsearch is built to handle diverse workloads across industries. Here’s where it shines and how to choose the right approach for each scenario.
Log Analytics
Collect and index logs from servers, applications, and cloud services in real time. Combined with services like Kinesis or Lambda, you can process streaming logs and visualize them in Kibana for faster troubleshooting and security analysis.
Best mode: Analytics — optimized for aggregations like “errors by hour” or “most common failure codes.”
Full‑Text Search
Deliver lightning‑fast search for e‑commerce catalogs, documentation libraries, or internal knowledge bases. Elasticsearch supports fuzzy matching, synonyms, and even geospatial queries to return relevant results quickly.
Best mode: Search — built for sub‑100ms response times and precise keyword matching.
Real‑Time Application Monitoring
Ingest application metrics and traces into Elasticsearch to track performance, detect anomalies, and respond to issues before they escalate. Pair with CloudWatch or APM tools for deeper observability.
Best mode: Both — search for specific error patterns, then run analytics to spot performance trends.
Choosing the Right Mode: Search vs. Analytics
- Search: Ideal when speed and precision are critical (e.g., product lookup, log filtering).
- Analytics: Best for exploring large data sets, aggregating metrics, and spotting trends.Pick based on the question you’re trying to answer — “find this exact thing now” vs. “show me patterns over time.”
Core Concepts You Should Know
Before deploying AWS Elasticsearch, it’s important to understand a few foundational elements that will save you time, prevent bottlenecks, and help your clusters run smoothly.
Clusters and Nodes
An Elasticsearch cluster is a group of servers called nodes, each with a role:
- Master Node: Manages cluster state and shard allocation. Best practice is to have at least 3 dedicated master nodes for high availability.
- Data Node: Stores indexed data and processes queries. Add more as your dataset or search load grows.
- Ingest Node: Pre‑processes incoming data before indexing, such as parsing logs or enriching fields.
Misconfigured nodes can cause outages or slow performance, especially if a master node fails.
Indices, Shards and Replicas
- Index: A collection of related documents, similar to a database (e.g., logs-2025).Shard: A partition of an index that allows queries to run in parallel.
- Replica: A copy of a shard for redundancy and faster reads.
Best practice: Adjust the default 5 primary shards and 1 replica based on workload. Too many shards cause overhead, too few cause slow queries. Use Index Lifecycle Management (ILM) to roll older indices into cheaper storage tiers automatically.
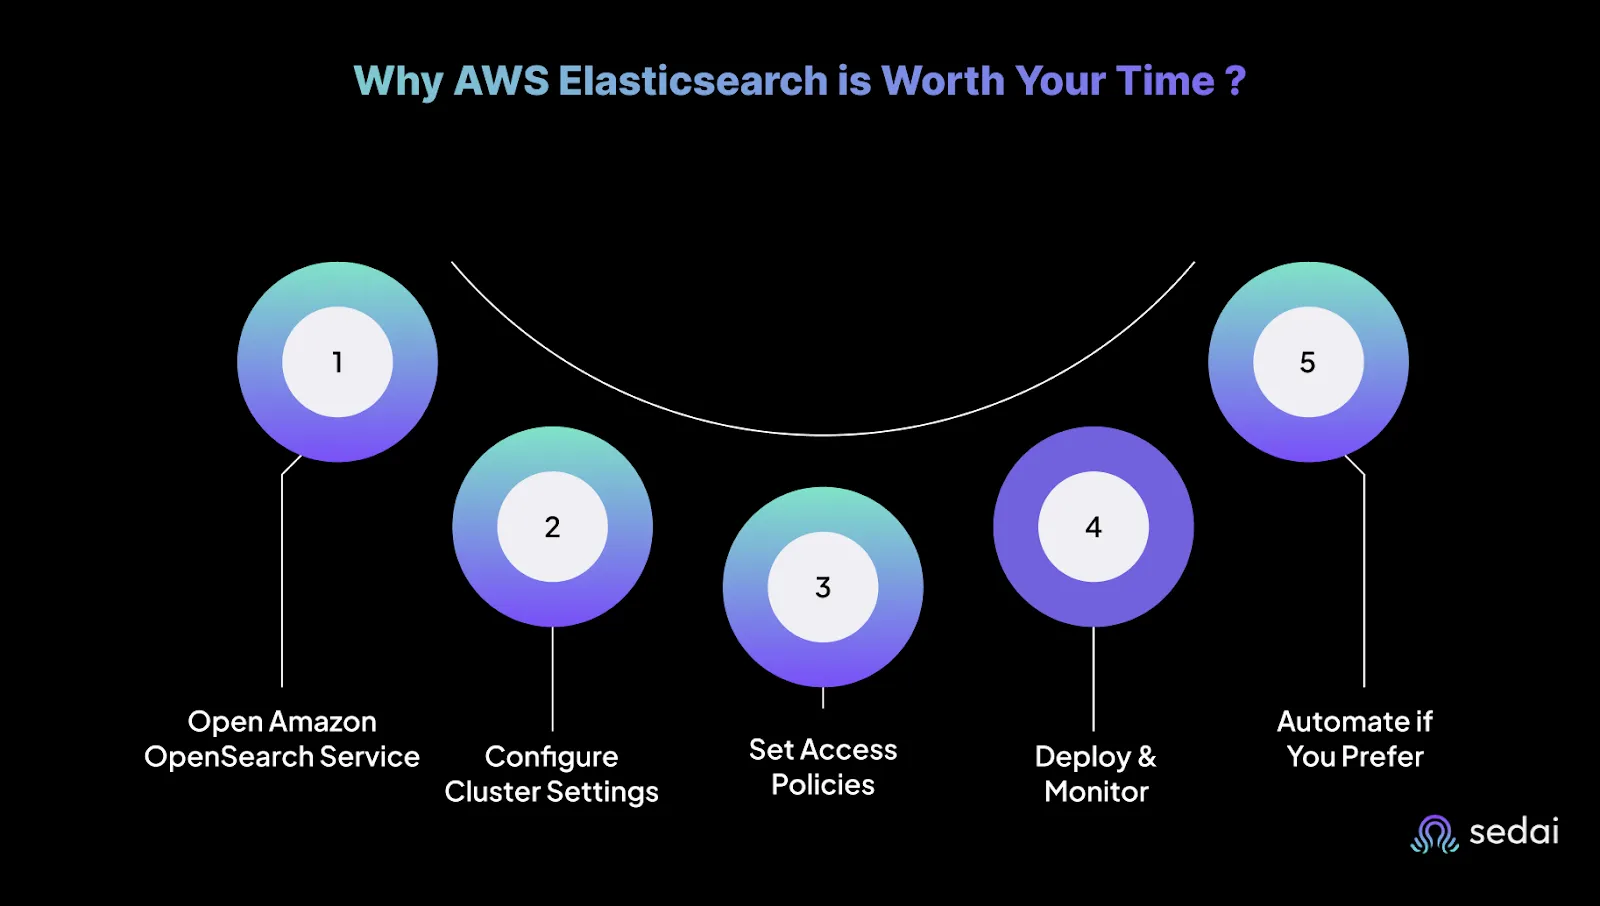
Setting Up Your First AWS Elasticsearch Domain

AWS Elasticsearch lets you deploy a production‑ready search and analytics cluster in minutes. Here’s how to set it up without overcomplicating things.
Step 1: Open Amazon OpenSearch Service
Go to the AWS Management Console and search for “OpenSearch Service” (AWS renamed it from Elasticsearch, but the core technology is still the same). Click Create domain.
Step 2: Configure Cluster Settings
- Domain name: Use something clear like prod-search.
- Engine version: Choose Elasticsearch 7.10 (last version before AWS forked to OpenSearch).
- Instance type: For dev/test, use t3.small.elasticsearch; for production, start with m6g.large.elasticsearch.
- Storage: EBS defaults work for most; increase size for heavy log indexing.
- Instance count: Use at least 3 for high availability.
Step 3: Set Access Policies
- Fine‑grained access control: Enable it.
- Master user: Create a dedicated admin account, not your AWS root account.
- Network access: Restrict access to specific IAM roles or IP ranges. Avoid public endpoints.
Step 4: Deploy and Monitor
- Click Create and wait ~10 minutes.
- Check the cluster health dashboard (green is good, red means fix it now).
- Use CloudWatch to monitor CPU, memory, and search latency.
Step 5: Automate if You Prefer
Using AWS CLI:
aws es create-elasticsearch-domain \
--domain-name my-search-cluster \
--elasticsearch-version "7.10" \
--elasticsearch-cluster-config "InstanceType=m6g.large.elasticsearch,InstanceCount=3" \
--ebs-options "EBSEnabled=true,VolumeType=gp2,VolumeSize=100" \
--access-policies '{"Version":"2012-10-17","Statement":[{"Effect":"Allow","Principal":{"AWS":["arn:aws:iam::123456789012:user/admin"]},"Action":["es:*"],"Resource":"*"}]}'
Ingesting and Querying Data in AWS Elasticsearch
Once your domain is live, you need reliable ways to feed in data and retrieve insights quickly.
Ingesting Data
1. Bulk API:Best for large datasets. Use JSON‑formatted batches via the _bulk API for high‑throughput ingestion.Example:
curl -X POST "https://your-domain.es.amazonaws.com/_bulk" \
-H "Content-Type: application/json" \
--data-binary @logs.json
Pro tip: Keep batches 5–10MB to avoid timeouts.
2. AWS Lambda or Kinesis Firehose:
- Lambda: Pre‑process and load data from S3, DynamoDB, or APIs before indexing.
- Kinesis Firehose: Fully managed streaming ingestion for logs, clickstreams, or IoT data, with automatic retries and S3 backups.
Querying Data
1. Full‑Text Search:Ideal for unstructured data like logs, documents, or product descriptions:
GET /logs/_search
{
"query": { "match": { "message": "error_code_500" } }
}
2. Aggregations:Summarize data without external processing.
Examples: average response time, count of errors per hour.
Pro tip: Avoid wildcard queries in production — they’re performance heavy.
Cost Optimization for AWS Elasticsearch
Elasticsearch is fast, but your AWS bill can balloon just as quickly if you’re not careful. Here’s how to keep performance high without torching your budget.
Right‑Size Your Instances: Pick the smallest instance type that meets your needs, then scale up only when necessary.
- Dev/test: t3.small.elasticsearch is cheap and good enough.
- Production: Graviton2 (r6g.large.elasticsearch or bigger) delivers ~20% better price‑performance than x86.
Cut Storage Costs with UltraWarm: Archive old, infrequently accessed data into UltraWarm storage up to 90% cheaper than hot storage.
- Best for: compliance logs, historical analytics, audit trails.
- Automate with Index Lifecycle Management (ILM) to roll data over after 30–60 days.
Commit with Reserved Instances: If you know your cluster will run 24/7 for at least a year, Reserved Instances can save you up to 75% compared to On‑Demand. Convertible RIs let you switch instance types later if your workload changes.
Suggested read: AWS Cost Optimization: The Expert Guide (2025)
Security Best Practices for AWS Elasticsearch
A single misconfiguration can expose sensitive logs, customer data, or internal systems. Follow these steps to keep your cluster secure.
Fine‑Grained Access Control
- Assign permissions based on role.
- Map AWS IAM roles to Elasticsearch access:
- Read‑only for analysts, write access for developers.
- Use Kibana’s role management to control dashboard and index visibility.
Encrypt Data at Rest and in Transit
- At rest: Enable AWS KMS encryption when creating the cluster.
- In transit: Enforce TLS 1.2 or higher for all connections.
- Rotate encryption keys annually and track usage with AWS CloudTrail.
Restrict Public Access
- Avoid public endpoints. Use VPC isolation or AWS PrivateLink.
- Limit access to trusted IPs or AWS services like Lambda and EC2.
- Monitor VPC flow logs for unusual or unauthorized traffic.
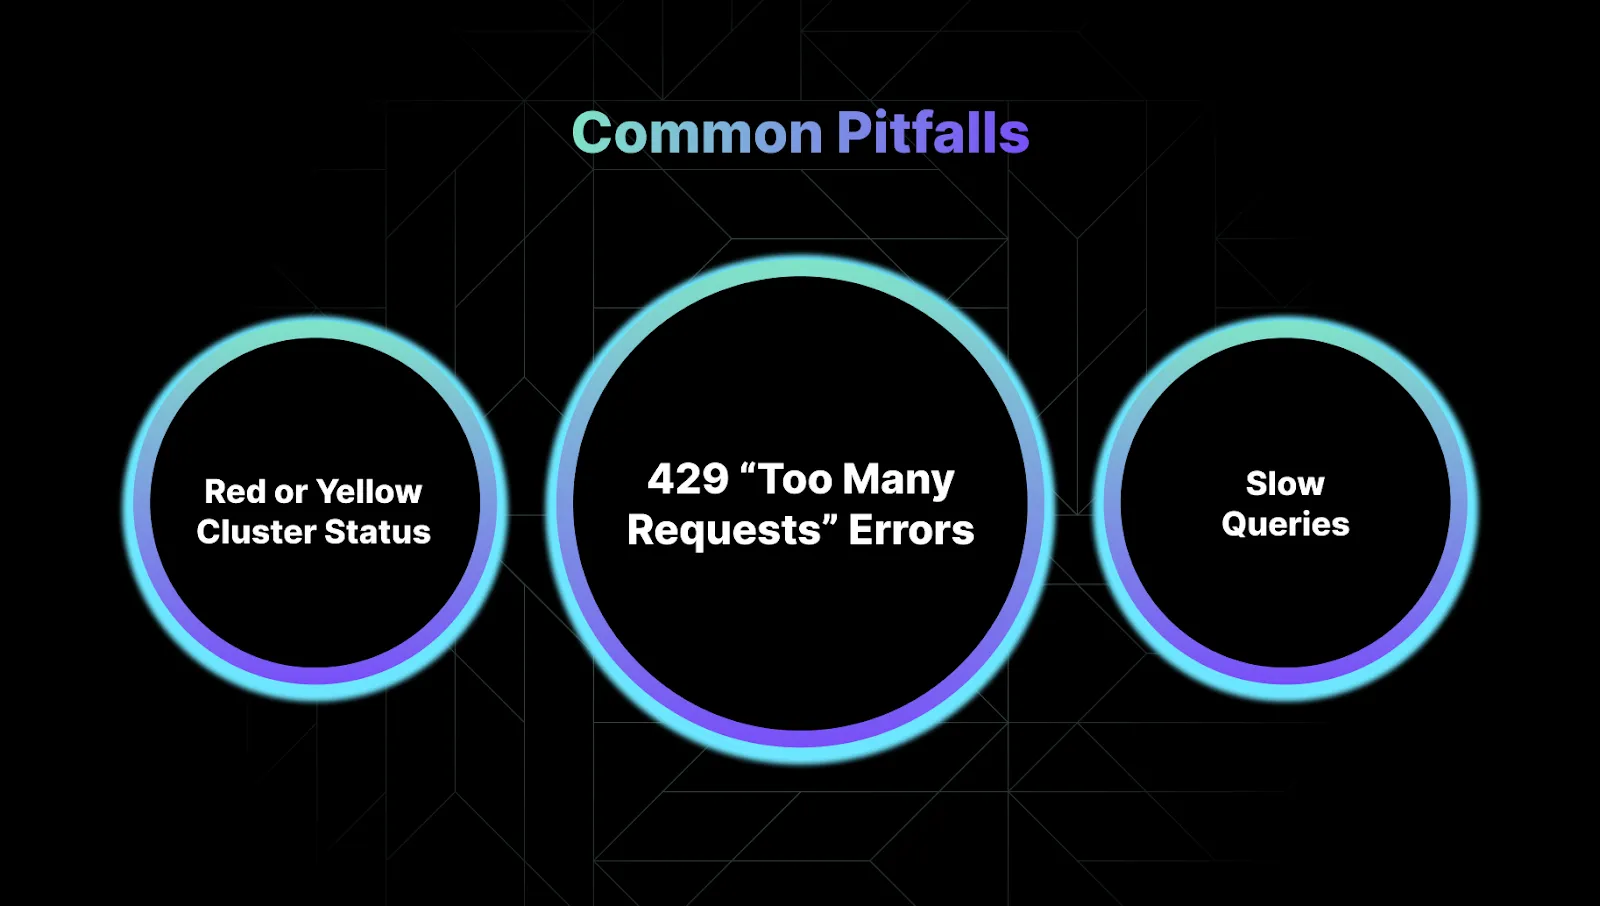
Common Pitfalls and How to Fix Them

Even with AWS managing the heavy lifting, Elasticsearch clusters can still run into issues. These are the most common problems and how to solve them.
1. Red or Yellow Cluster Status
A red status means at least one primary shard is missing, which puts your data at risk. A yellow status means that one or more replica shards are unassigned, which reduces redundancy.
How to fix: You can check _cluster/health to identify the issue. If your nodes are over 85% disk usage, either free up space by deleting old indices or scale your storage. Redistribute shards evenly across nodes and use Index Lifecycle Management (ILM) to automatically prevent indices from growing too large.
2. 429 “Too Many Requests” Errors
A 429 error means Elasticsearch is overloaded and cannot handle more requests. You can fix this by reducing your bulk request size and adding retries with exponential backoff in your ingestion pipeline.
How to fix: Scale your cluster by adding more data nodes or upgrading to memory‑optimized instances. Limiting the number of concurrent search requests can also reduce load and prevent this error.
33. Slow Queries
Slow queries often happen when mappings are too complex or index settings are inefficient.
How to fix: Always define explicit mappings rather than relying on dynamic ones, which can bloat your index with unnecessary fields. Use keyword fields for filtering to improve performance. Sorting indices by timestamp can also speed up time‑based queries significantly.
How Sedai Can Help Optimize AWS Elasticsearch
As Elasticsearch clusters grow, it becomes harder to keep them performant and cost‑efficient. Many companies now use AI platforms like Sedai to help manage this complexity.
Sedai monitors clusters in real time, flags potential bottlenecks, and recommends scaling or configuration changes before they affect performance. It also provides cost insights so teams can right‑size resources and avoid waste.
Some of the most impactful uses for Sedai are:
- Automating scaling to match workload demands.
- Detecting anomalies early to prevent downtime.
- Analyzing usage trends to cut unnecessary spend.
Also read: Cloud Optimization: The Ultimate Guide for Engineers
Final Thoughts
AWS Elasticsearch delivers powerful search and analytics capabilities without the overhead of running your own clusters. But keeping it fast, reliable, and cost‑efficient over time still requires careful monitoring and tuning.
AI‑driven tools like Sedai can help simplify this ongoing work by optimizing clusters automatically, detecting issues early, and keeping costs in check. If you want to spend less time troubleshooting and more time building, explore how Sedai can support your Elasticsearch operations. Join the movement today.
FAQ
1. How do I check if my Elasticsearch cluster is healthy?
Run GET _cluster/health?pretty in Kibana or via curl. Green = good, Yellow = replicas missing, Red = data loss risk.
2. Why am I getting 429 “Too Many Requests” errors?
Your cluster is overloaded. Reduce bulk request sizes, add retry logic, or scale up nodes.
3. What’s the fastest way to speed up slow queries?
- Define explicit mappings (avoid dynamic fields).
- Use keyword (not text) for filtering.
- Enable doc_values for numeric/date aggregations.
4. How do I prevent shard allocation issues?
- Keep disk usage below 85%.
- Use ILM policies to auto-manage index sizes.
- Avoid imbalanced shards with total_shards_per_node.
5. Can Sedai automate Elasticsearch management?
Yes. Sedai can help cut costs so you don’t have to micromanage, it automates your spending and makes the monitoring process easier than before which actually helps in your Elasticsearch management.

