Optimizing GCP performance and cost involves understanding resource utilization and scaling options across compute, storage, and autoscaling services. Misconfigurations such as overprovisioned VMs, improper autoscaling settings, and unoptimized BigQuery queries can lead to wasted resources and higher expenses. By monitoring and adjusting resources based on real workload behavior, teams can prevent inefficiencies and ensure a balance between performance and cost.
A GCP environment struggling with traffic spikes or underutilized resources can be frustrating, especially when performance drops and costs rise unexpectedly.
This issue isn’t rare. Industry reports find that about 30% of cloud resources are underutilized across enterprise deployments, meaning many VMs and services sit idle or deliver far less capacity than they’re provisioned for.
Many teams rely on default configurations that do not dynamically adapt to real-time traffic patterns, resulting in wasted resources or sluggish performance during critical periods.
Most cloud services run with more compute or storage than they actually need, resulting in inefficiency and unnecessary costs. Under-utilized VMs, suboptimal storage setups, and poorly tuned autoscaling often go unnoticed until the monthly bill reveals the impact.
That’s where optimization plays a major role. By fine-tuning compute resources, storage configurations, and autoscaling policies based on real usage metrics, you can keep GCP workloads both cost-efficient and high-performing.
In this blog, you’ll discover practical strategies to optimize GCP performance, ensuring your cloud infrastructure remains responsive and budget-conscious, no matter the scale of your workloads.
What is GCP Optimization?
GCP optimization is the process of tuning your Google Cloud workloads to run efficiently, remain reliable, and avoid unnecessary costs.

Instead of relying on defaults or rough estimates, engineers make optimization decisions based on real production behavior. This refers to how services actually use compute, storage, databases, and serverless platforms.
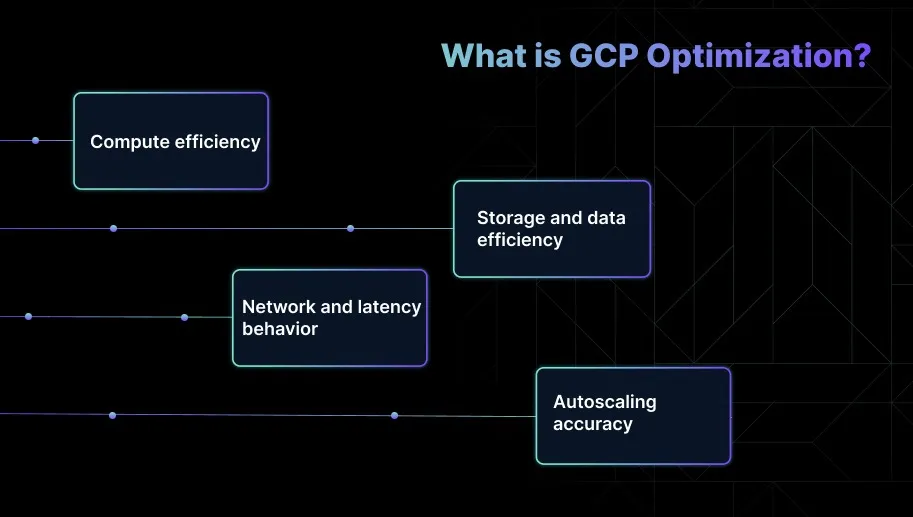
At a high level, GCP optimization revolves around four core areas.
1. Compute efficiency
Compute Engine VMs, GKE nodes, and Cloud Run services often run with more CPU or memory than the workloads actually need. Over time, this leads to low utilization, slower scaling, and avoidable cloud spend.
Optimization here means aligning machine types, pod limits, and concurrency settings with real traffic patterns and performance data.
2. Storage and data efficiency
Choices around Cloud Storage classes, CloudSQL sizing, and BigQuery scanning directly impact speed and cost.
Effective optimization includes selecting the right storage class based on access patterns, tuning CloudSQL instances for steady throughput, and reducing the number of BigQuery scanned bytes.
3. Network and latency behavior
Load balancers, region placement, and CDN configuration play a major role in both user experience and egress costs.
Optimization involves positioning workloads in the right regions, reducing unnecessary cross-region traffic, and caching responses so applications remain fast and predictable.
4. Autoscaling accuracy
Many GCP workloads scale too late or too aggressively because their autoscaling policies monitor the wrong signals.
Improving accuracy involves tuning HPA triggers, adjusting Cloud Run concurrency, and refining Compute Engine autoscaling rules based on queue depth, p95 latency, CPU limits, or throttling.
Once the idea of GCP optimization is clear, the next step is understanding why it holds so much value for engineering teams.
Suggested Read: How to Choose Savings Plans & RIs for AWS, Azure & GCP
Why GCP Optimization Matters for Engineering Teams?
GCP optimization matters because it directly affects application performance, incident rates, and cloud spend.
When configurations drift, or workloads grow, even small misalignments in compute, storage, or autoscaling settings can become measurable engineering problems.
Here’s why GCP optimization matters for your teams:
1. Slow applications and higher latency
Under-tuned GKE pods, oversized Cloud Run instances, or poorly placed services add latency during traffic spikes. These issues usually appear first in p95 and p99 metrics.
You can then spend time chasing symptoms such as hitting resource limits, cold starts, or slow upstream dependencies.
2. Unpredictable scaling and avoidable incidents
Default autoscaling on Compute Engine, GKE, or Cloud Run often reacts too late. This leads to queue backlogs, connection saturation, and higher error rates during bursts.
Tuning autoscaling based on real workload signals helps reduce paging and improve system reliability.
3. Silent waste that inflates the cloud bill
Idle VMs, underutilized node pools, unpartitioned BigQuery tables, and unused persistent disks increase costs without offering any performance benefit.
These patterns usually stay hidden until monthly reports show unexpected spikes. Teams lose budget flexibility because resource usage was never aligned with demand.
4. Bottlenecks that slow the development velocity
When builds, queries, or environments run slowly, teams move more slowly. BigQuery scans that take minutes instead of seconds, or CloudSQL instances operating near IOPS limits, create friction at every stage of the development process.
5. Reliability gaps that accumulate over time
Configuration drift across environments leads to scaling delays, inconsistent performance, and surprising failures. Without ongoing optimization, each new release adds more load to settings that no longer reflect real traffic patterns.
How to Optimize for Performance in a GCP Environment?
Optimizing performance in GCP starts with tuning compute, autoscaling, and data paths so they align with how your workloads behave under real traffic.

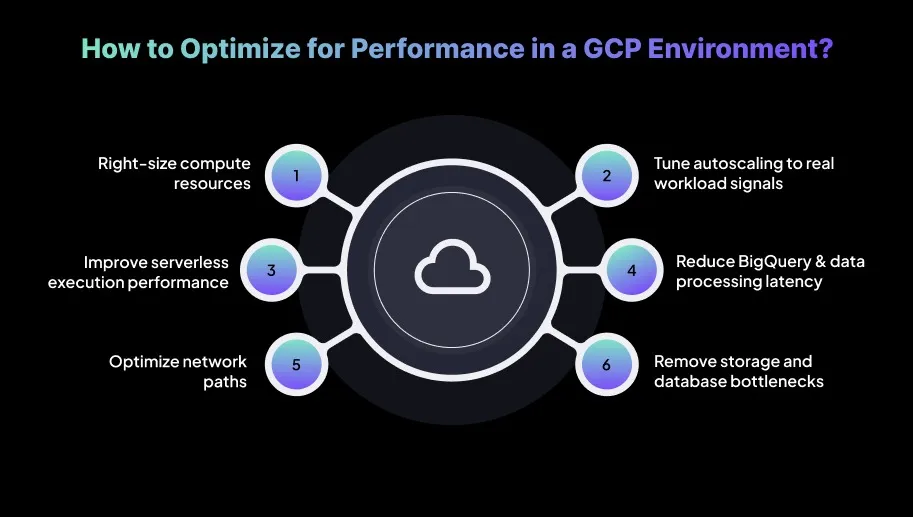
You need to focus on areas where misconfigurations quickly surface in p95 latency, error rates, and overall resource usage. Here’s how to optimize for performance in a GCP environment:
1. Right-size compute resources
Most compute inefficiency comes from VMs and GKE nodes sized for traffic patterns that no longer exist. Teams often inherit machine types selected years ago, leading to overprovisioning and unnecessary latency headroom.
How to do it:
- Review real workload usage: Open Cloud Monitoring and chart CPU and memory utilization for each Compute Engine instance group or GKE node pool across at least two weeks of real traffic.
- Spot consistently underused machines: Identify VMs or nodes with CPU below 15% or memory below 30%. This almost always signals over-provisioning.
- Match machine families to workload type: Compare current machine families against recommended families. For general workloads, evaluate N2 or N2D. For CPU-heavy services, evaluate C2.
- Downsize gradually and validate behavior: Reduce machine size one step at a time, and monitor p95 latency and CPU throttling for 24 hours after the change.
- Check pod packing efficiency: If using GKE, check the node's allocatable CPU against the pod's requests. If requests fill only half the node, adjust pod limits or move to a smaller node type.
Key metrics: CPU utilization, memory utilization, throttled CPU time, allocatable versus requested CPU
Common mistakes:
- Ignoring disk throughput requirements during downsizing
- Scaling node sizes up to fix pod OOMs instead of correcting pod limits
2. Tune autoscaling to real workload signals
Scaling failures usually occur when engineers use the CPU as the default trigger for workloads that are actually bottlenecked by latency or queue depth.
How to do it:
- Identify what actually drives load: For request-driven services, inspect request latency and queue depth. For compute-driven services, monitor CPU and memory.
- Use the right metric for GKE autoscaling: Configure the Horizontal Pod Autoscaler to use the correct metric. If latency drives load, feed custom latency metrics rather than relying on CPU alone.
- Test real scale-out behavior: Run synthetic traffic to see how long nodes take to join and adjust scale-up delay or buffer capacity if needed.
- Pick the right policy for VM autoscaling: For Compute Engine instance groups, choose autoscaling policies tied to CPU, LB capacity, or a custom metric. Avoid relying on a single threshold.
- Set Cloud Run concurrency based on real parallelism: If a service can handle ten parallel requests, set concurrency to ten to prevent excessive instance creation.
Key metrics: p95 latency, queue depth, requests per second, instance startup time, pending pods
Common mistakes:
- Relying solely on the CPU for IO- or latency-bound services
- Leaving cooldown periods too long, causing scaling lag
- Keeping Cloud Run concurrency at one without validation
3. Improve serverless execution performance
Serverless performance issues often stem from cold starts, suboptimal memory allocation, or region choices that increase p95 latency.
How to do it (Cloud Run):
- Check for cold-start impact in execution variance: Examine execution time distribution. If cold starts dominate p95 latency, configure a small number of minimum instances.
- Increase memory to improve execution speed: Faster execution often reduces total cost. Increase memory and CPU allocation for functions with slow execution.
- Choose the right region for better latency: Deploy workloads closest to key user traffic or upstream services.
How to do it (Cloud Functions):
- Raise memory when execution time fluctuates: Functions with high execution-time variance often perform better with more memory.
- Use logs to detect cold-start patterns: Use Cloud Logging queries to identify cold-start frequency.
- Tune retries to avoid cascading failures: Review retry settings to prevent cascading retries during intermittent slowdowns.
Key metrics: execution variance, cold-start counts, memory usage, instance creation count
Common mistakes:
- Avoiding memory increases due to cost assumptions
- Ignoring cold starts on low-traffic functions
4. Reduce BigQuery and data processing latency
BigQuery performance issues usually originate from unpartitioned tables, unnecessary full scans, and repeated heavy joins.
How to do it:
- Identify heavy queries from audit logs: Flag queries scanning over one hundred gigabytes as immediate optimization targets.
- Partition tables to restrict scanned data: Use timestamp or high-selectivity columns for partitioning frequently filtered data.
- Cluster data for faster filtering and joins: Cluster tables by columns used in JOINs or WHERE clauses.
- Inspect execution plans for waste: Detect full scans, repeated joins, or unnecessary shuffles in query plans.
- Use materialized views for repeated query patterns: Replace high-frequency subqueries when the underlying data changes infrequently.
- Increase parallelism in slow ETL pipelines: Tune Dataflow worker types or autoscaling behavior to reduce pipeline durations.
Key metrics: bytes scanned, slot usage, slot contention, execution time
Common mistakes:
- Using SELECT * in large datasets
- Allowing dashboards to query unpartitioned fact tables
- Running heavy analytical queries in interactive mode
5. Optimize network paths
Performance issues often come from poor regional placement or unnecessary cross-region traffic. You can also underestimate the latency impact of global load balancers on regional traffic.
How to do it:
- Trace traffic paths to find unnecessary hops: Use Connectivity Tests to map traffic paths and identify cross-region calls.
- Choose load balancers aligned with the traffic scope: Use regional load balancers when the user base is regional.
- Enable CDN caching for repeated content: Cloud CDN can cache content and improve response times.
- Monitor egress to expose inefficient data movement: Track egress by region in the billing console to uncover hidden cross-region transfers.
- Use optimized internal routing: Use VPC peering or Private Service Connect to improve internal traffic routing and reduce latency.
Key metrics: cache hit ratio, egress volumes, LB latency, RTT
Common mistakes:
- Deploying all services in one region despite distributed users
- Serving static assets directly without CDN caching
6. Remove storage and database bottlenecks
CloudSQL, Cloud Storage, and Bigtable/Firestore bottlenecks create slow queries, connection timeouts, and stalled pipelines. You often scale vertically when the real issue is connection saturation or poor data layout.
How to do it (CloudSQL):
- Watch key saturation metrics closely: Monitor CPU, active connections, and IOPS during peak load.
- Add pooling to avoid connection storms: Implement PgBouncer or enable pooling in the Cloud SQL Auth Proxy.
- Enable auto storage scaling to prevent outages: Configure automatic storage increases to avoid space exhaustion.
How to do it (Cloud Storage):
- Match storage class to access frequency. Move frequently accessed objects out of archival classes.
- Use parallel operations for higher throughput. Leverage parallel operations for large objects.
- Apply lifecycle rules to control long-term storage cost. Shift stale data automatically to cheaper tiers.
How to do it (Bigtable / Firestore):
- Detect hot partitions through latency patterns. Watch the read/write latency distribution to locate uneven load.
- Fix skewed key designs early. Redesign key patterns to distribute traffic evenly.
Key metrics: CloudSQL CPU, active connections, disk IOPS, throughput, read/write latency
Common mistakes:
- Scaling CloudSQL vertically when the real issue is a lack of pooling
- Ignoring warning logs about hot partitions in Bigtable or Firestore
- Leaving infrequently accessed data in high-cost storage classes.
Useful Tools to Help You Optimize GCP Faster
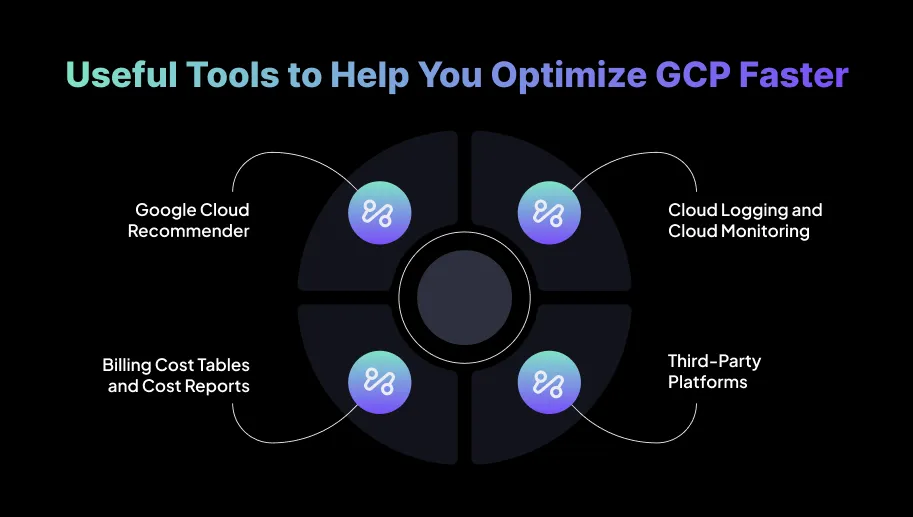
These tools help you identify bottlenecks, optimize workloads, and eliminate silent cost drift across GCP. Each tool supports faster debugging, safer scaling, and more predictable performance.

1. Google Cloud Recommender
Google Cloud Recommender surfaces misconfigurations and unused resources that are easy to overlook in complex GCP environments.
- Use rightsizing insights to validate VM and GKE node sizes: It highlights instances that consistently run below capacity, helping engineers spot over-provisioned machines.
- Detect idle assets before they become cost problems: Unused disks, abandoned IPs, and dormant VMs often slip through daily operational checks.
- Apply targeted service improvements: The tool provides actionable suggestions for BigQuery layouts, CloudSQL configurations, IAM permissions, and load balancer setups.
2. Cloud Logging and Cloud Monitoring
These tools give engineers the metrics they rely on to tune autoscaling and investigate performance slowdowns.
- Build dashboards around p95 latency, throttled CPU, and queue depth: These signals surface bottlenecks long before conventional CPU or memory charts reveal issues.
- Set alerts for conditions that precede incidents: Early warnings such as CloudSQL saturation, GKE eviction events, and delayed instance startups help teams prevent outages.
- Validate scaling policies with real-time signals: Track pending pods, HPA decisions, and Cloud Run instance churn during traffic spikes to ensure autoscaling reacts as expected.
3. Billing Cost Tables and Cost Reports
These tools help engineers connect cost anomalies directly to the workloads causing them.
- Drill into cost by service, project, or label: This isolates the specific workloads driving unexpected spend and highlights areas for optimization.
- Review SKUs with noticeable growth: Cost spikes often trace back to unpartitioned queries, under-optimized autoscaling, or excessive network traffic.
- Monitor commitment utilization: Unused commitments usually indicate oversized compute footprints that could be resized or repurposed.
4. Third-Party Platforms
Third-party platforms like Sedai automate tasks that would otherwise require ongoing manual tuning. It focuses on actual workload behavior instead of static thresholds.
- Autonomous rightsizing for Compute Engine, GKE, and Cloud Run: Adjusts CPU, memory, pod limits, and concurrency based on observed usage, throttling, and latency patterns.
- Predictive autoscaling to prevent scaling delays: Rather than reacting after p95 latency spikes, it scales ahead of demand by learning traffic patterns and workload saturation points.
- Automatic remediation for inefficient or unstable workloads: Addresses misconfigured autoscaling thresholds, tunes node pools, adjusts service-level resources, and resolves patterns that often lead to incidents.
These capabilities reduce engineering toil and ensure GCP workloads remain efficient without depending on periodic manual audits or scripts.
Also Read: AWS vs Azure vs GCP VMs: 2026 Comparison for Cloud Engineers
Common Mistakes Engineers Make in GCP (& How to Avoid Them)
Even with all the power GCP offers, common mistakes can drive up costs, degrade performance, and cause reliability issues. Here are the key errors engineers often make and how to prevent them.
How Sedai Helps Optimize GCP Performance?
Many GCP tools claim to optimize performance, but most depend on manual configurations and static thresholds that can’t keep up with dynamic workloads.
These traditional approaches often result in inefficient resource usage, over-provisioning, and higher cloud costs.
Sedai stands out by providing autonomous optimization. Powered by reinforcement learning, Sedai continuously adapts to real-time workload behavior, keeping your GCP environment efficient, responsive, and cost-effective, all without manual intervention.
What Sedai offers for GCP optimization:
- Autonomous Rightsizing: Sedai adjusts compute resources, storage allocation, and network configurations based on real-time usage data to ensure optimal resource utilization. This delivers up to 30% cost savings by aligning resources with actual demand, ensuring efficient scaling.
- Predictive Autoscaling: Sedai uses machine learning to predict traffic and workload patterns, enabling real-time autoscaling decisions. This prevents scaling delays, ensuring consistent performance during high-demand periods.
- Full-stack Optimization: Sedai optimizes all aspects of your GCP infrastructure, including compute, storage, and networking. It reduces cloud costs by adjusting resources based on actual needs, ensuring performance stays aligned with usage patterns.
- Automatic Remediation for Performance Issues: Sedai proactively detects and resolves performance bottlenecks, resource saturation, and pod instability. This automation significantly reduces the need for manual intervention, improving engineering productivity and system reliability.
- Cross-Platform and Multi-Cloud Support: Sedai supports GKE, EKS, AKS, and on-prem Kubernetes environments, providing consistent optimization across multiple cloud providers and hybrid infrastructures, allowing you to manage multi-cloud workloads efficiently.
- SLO-Driven Scaling: Sedai aligns autoscaling decisions with Service Level Objectives (SLOs) and Service Level Indicators (SLIs), ensuring that scaling decisions align with business priorities and improve reliability and performance while managing costs effectively.
By using Sedai’s autonomous optimization, your GCP workloads stay high-performing while minimizing unnecessary resource spend. Continuous, data-driven adjustments ensure your cloud environment is tuned to real-time demands.
If you want to improve your GCP optimization with Sedai, use our ROI calculator to estimate potential savings by reducing waste, boosting performance, and eliminating manual maintenance efforts.
Final Thoughts
Optimizing for performance in GCP involves a combination of right-sizing resources, fine-tuning autoscaling policies, and improving data handling. But true efficiency in GCP requires promoting a culture of continuous optimization.
By regularly reviewing resource utilization, performing periodic audits, and using tools that automate adjustments, like Sedai, you can maintain an agile and cost-efficient GCP environment over the long term.
Sedai automatically analyzes workload behavior, predicts resource requirements, and adjusts resources to sustain efficiency without manual intervention.
By combining intelligent automation with team alignment, you can implement continuous GCP optimization, keeping performance high, costs predictable, and your teams focused on innovation.
Achieve full transparency in your GCP environment and quickly eliminate wasted resources and unnecessary expenses.
Must Read: Choosing the Right Instance Types for Rightsizing in GCP
FAQs
Q1. What’s the best way to monitor and optimize GCP costs without sacrificing performance?
A1. Use Google Cloud’s Cost Management tools alongside real-time monitoring dashboards to track metrics like CPU utilization, network egress, and BigQuery scan volume. Rightsize VMs, leverage Preemptible VMs for non-critical workloads, and automate cost alerts and resource scaling with Cloud Functions.
Q2. How can I optimize CloudSQL performance without adding extra replicas?
A2. Improve query performance with indexing and partitioning, and use connection pooling tools like PgBouncer to reduce overhead. Monitor and adjust CPU and memory allocations to prevent saturation and avoid hitting IOPS or CPU limits during peak load.
Q3. What role do Cloud Load Balancers play in GCP optimization?
A3. Load balancers distribute traffic evenly, reduce latency, and maintain high availability across resources. Use regional load balancers for local traffic to minimize egress costs and global load balancing only when traffic spans multiple regions.
Q4. How do I handle scaling issues for serverless GCP services like Cloud Run?
A4. Adjust minimum instances and concurrency settings to match real workload parallelism and monitor cold start durations in Cloud Logging. This ensures fast responsiveness while avoiding unnecessary instance creation and extra costs.
Q5. Can GCP optimization tools help reduce cloud-related security risks?
A5. Yes, tools like Google Cloud Recommender provide actionable security recommendations alongside performance and cost insights. Optimizing IAM roles, access control, and cleaning up unused resources improves both security and efficiency.

