Optimizing Kubernetes resources starts with understanding how CPU, memory, storage, and network settings impact both performance and cloud spend. Misaligned requests, wrong limits, and inefficient node pools often lead to throttling, OOMKills, wasted compute, and unpredictable autoscaling behavior. By tuning requests using real usage data, fixing bin-packing gaps, and aligning workloads with the right node types, engineering teams can cut costs without hurting performance.
Finding a Kubernetes cluster running at scale quickly reveals where hidden waste lives. Many teams over-request CPU and memory to “stay safe,” leaving clusters appearing heavily utilized on paper while workloads barely use the resources they reserve.
This pattern isn’t unique. BCG estimates that nearly 30% of cloud spend goes to waste, and improving efficiency could unfold up to USD 3 trillion in EBITDA by 2030. That kind of misalignment shows just how much room there is to improve both performance and cost across Kubernetes environments.
That’s where Kubernetes resource optimization becomes essential. By right-sizing workloads, tuning resource limits, and aligning scaling with actual usage, clusters stay more stable while operating far more efficiently.
In this blog, you’ll explore the practical steps engineers can follow to cut waste, improve performance, and keep Kubernetes costs under control.
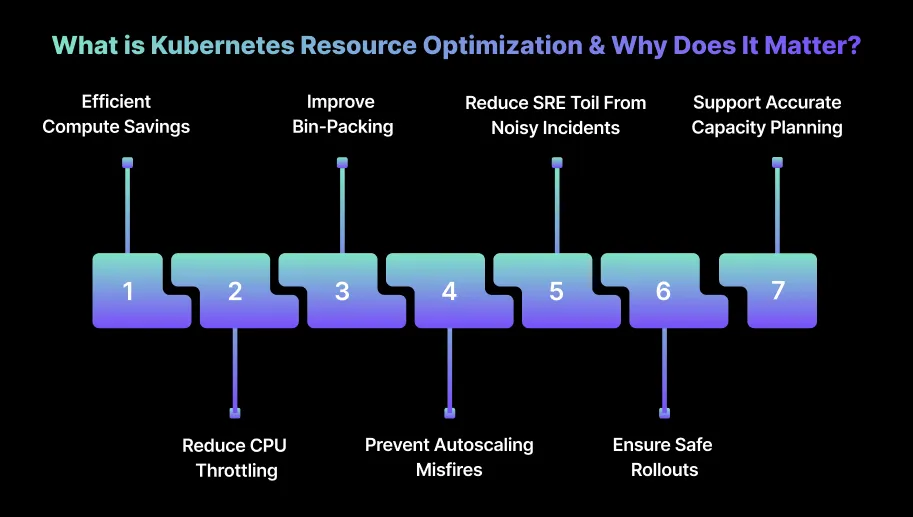
What is Kubernetes Resource Optimization & Why Does It Matter?
Kubernetes resource optimization is all about aligning CPU, memory, storage, and network allocations with what your workloads actually need at runtime. The idea is to reduce waste without compromising performance.

When your requests and limits match real usage, pods run smoothly, nodes are utilized more efficiently, and autoscaling becomes far more predictable.
All of this directly impacts how reliably your applications run and how much you end up paying for your infrastructure. Here’s why Kubernetes resource optimization matters:
1. Lower Compute Costs Without Sacrificing Performance
When CPU and memory are over-requested, clusters end up running more nodes than needed across AWS, Azure, or GCP. Aligning requests with real usage helps reduce the node count safely without increasing latency or causing errors.
2. Reduce CPU Throttling and Memory Pressure
Tight limits often lead to throttling or OOMKills, even when actual usage isn’t that high. Adjusting limits properly prevents these slowdowns and keeps services stable during traffic spikes.
3. Improve Bin-Packing and Node Utilization
Accurate requests give the scheduler room to pack pods more efficiently. This leads to smoother node scale-down and avoids situations where the cluster autoscaler can’t move workloads.
4. Prevent Autoscaling Misfires
HPA tends to behave unpredictably when workloads are mis-sized. Right-sized pods avoid unnecessary scale-outs from short CPU bursts or GC spikes, making replica counts much more stable.
5. Reduce SRE Toil From Noisy Incidents
A lot of recurring alerts come from resource misconfigurations, such as throttling, restarts, and eviction pressure. Fixing sizing removes these repeated pain points for SRE and platform teams.
6. Ensure Safe Rollouts and Release Stability
Incorrect resource settings increase the chances of regressions during deployments. Properly optimized requests and limits help new releases run consistently without surprise container restarts.
7. Support Accurate Capacity Planning
Right-sized workloads generate clean, reliable telemetry. This makes it easier for your teams to plan node groups, autoscaling policies, and cloud commitments with confidence.
Once you understand why Kubernetes resource optimization matters, it makes it easier to apply core strategies for reducing costs effectively.
Suggested Read: Kubernetes Cluster Scaling Challenges
7 Core Strategies for Reducing Kubernetes Costs
Kubernetes costs rise when workloads are oversized, autoscaling isn’t configured properly, or nodes remain online even when underutilized. You can address the issues that block efficient bin-packing, increase node counts, and cause unnecessary scale-outs.
These strategies target the areas where clusters most commonly waste resources and inflate cloud spend. Below are these strategies to minimize Kubernetes costs.
1. Right-Size CPU and Memory Requests the Proper Way
Right-sizing fails when you size requests based on intuition instead of real usage patterns. You avoid this by tuning requests for the scheduler and limits for application behavior strictly based on hard metrics.
How to do it:
- Measure real usage: Pull 30–45 days of CPU usage and memory RSS per container; ignore p99 spikes and size for p90–p95 so bin-packing stays efficient.
- Check CPU limits: Compare pod CPU throttling with CPU usage; if throttling occurs at <60% CPU usage, your CPU limit is too tight.
- Check memory: For memory, check if pod memory ever crosses 80% of the limit; if not, reduce limits or remove them.
- Recalculate requests over time: Recalculate requests when code changes (new dependency, new cache logic, new feature flags) because resource shapes drift over time.
- Validate results: After changes, validate with throttling=0 or near-zero, OOMKills=0, node packing density improving, and CA scale-down occurring consistently.
Tip: Measure actual CPU and memory usage over 30–45 days and size requests for p90–p95 usage to avoid over-provisioning. Always validate changes by checking throttling, OOMKills, and node packing to ensure performance is stable.
2. Use Karpenter for Faster, Cost-Efficient Node Provisioning
Karpenter fixes the two biggest CA problems: slow scale-up and inability to consolidate half-empty nodes. You’ll see cost drops when Karpenter consistently replaces inefficient nodes with cheaper or better-fitting ones.
How to do it:
- Configure node ratios: Configure a Provisioner with explicit CPU: Memory ratios so Karpenter picks nodes that match your dominant workload shapes.
- Enable consolidation: Check that your workloads aren’t blocked by PDBs or replica anti-affinity rules, both of which cause “drain failed” loops.
- Allow multiple instance families: Allow multiple instance families (m5/m6g/c6a/r6i) so Karpenter finds cheap capacity instead of being stuck with one type.
- Mix Spot and On-Demand: Add Spot + On-Demand capacity in the same Provisioner, but restrict critical services with nodeSelector to avoid landing on Spot accidentally.
- Validate: Validate success by checking shorter scale-up times (<60s), lower unused node count, and fewer nodes stuck at <50% utilization.
Tip: Configure CPU:Memory ratios, enable consolidation, and allow multiple instance families to maximize bin-packing efficiency. Monitor scale-up times and unused nodes to confirm cost reductions and improved cluster responsiveness.
3. Use Spot Instances Safely for Interruptible Kubernetes Workloads
Spot works only if your workloads can fail without breaking user traffic. You need to focus on building enough redundancy, not eliminating interruption risk.
How to do it:
- Dedicated Spot pool: Create a dedicated Spot-only node pool with taints, then add tolerations to only safe workloads (workers, batch, CI jobs).
- Diversify instance families: Diversify across at least 4–6 instance families so one pool interruption doesn’t wipe out the node group.
- Handle eviction gracefully: Add a termination hook that sends SIGTERM to your application and drains the node. Check pod shutdown time so you don’t exceed the 2-minute eviction window.
- Maintain availability: Add Pod Disruption Budgets to keep replicas available even during multiple Spot drains.
- Validate: Validate by checking low eviction failure rate, pods restarting cleanly on On-Demand fallback nodes, and Spot interruptions not affecting p95 latency.
Tip: Assign only non-critical workloads to Spot nodes with proper taints, tolerations, and Pod Disruption Budgets. Always plan for graceful evictions to maintain service reliability during interruptions.
4. Build Node Pools Around Real Workload Profiles
Shared node pools cause fragmentation — memory-heavy workloads block CPU-heavy workloads and vice versa. You can increase node packing and reduce noisy-neighbor contention by splitting pools based on workload shape.
How to do it:
- Tag nodes: Tag nodes with labels like workload=cpu-heavy, workload=memory-heavy, workload=general, and assign pods through node selectors or affinities.
- Split pricing categories: On-Demand → user-facing + latency-sensitive; Spot → interruptible workloads; Reserved → stable long-running services.
- Tune pools independently: Tune each pool with autoscalers so noisy services in one pool don’t force scaling in the others.
- Validate: Monitor node utilization distribution, bin-packing efficiency, and whether mixed workloads still spill into inappropriate pools.
Tip: Split nodes by CPU-heavy, memory-heavy, and general workloads, tuning autoscalers per pool. Monitor utilization and packing efficiency to ensure different workloads do not block each other.
5. Shrink Container Images to Reduce Pull Time and Node Startup Delays
Large images increase cold-start latency and cross-zone egress costs. You feel the real impact during scaling events where hundreds of pods pull images simultaneously.
How to do it:
- Switch base images: Switch from Ubuntu/Debian to Alpine/Distroless and measure image pull times on a fresh node for each change.
- Use multi-stage builds: Remove compilers, package managers, and caches — final images should contain only runtime binaries and assets.
- Collapse layers: Collapse image layers and remove unused RUN statements to avoid layer bloat.
- Inspect layers: Run docker history or dive to inspect which layers drive size and prune them explicitly.
- Validate: Check for faster pod start times on cold nodes, lower image storage use, and fewer cross-AZ egress charges.
Tip: Use minimal base images, multi-stage builds, and collapsed layers to lower image sizes. Validate faster pod start times and reduced storage costs during scale-up events.
6. Optimize Persistent Volumes and Eliminate Storage Waste
Storage waste happens when PVs, snapshots, or oversized disks accumulate silently. You rarely get alerts for this kind of waste. It just shows up in monthly charges.
How to do it:
- Scan PVs weekly: Compare them to active PVCs; delete any PV in “Released” or “Failed” state.
- Use reclaimPolicy: Switch non-critical workloads to reclaimPolicy: Delete so volumes are automatically removed when pods die.
- Downsize volumes: Resize or downsize volumes where usage is <20% for several weeks. These are typically oversized.
- Set retention policies: Automatically purge old EBS/GCE snapshots not referenced by any volume.
- Validate: Reduced “zombie” volume count, lower monthly storage charges, and fewer multi-GB snapshots piling up.
Tip: Regularly delete unused PVs, set reclaim policies to auto-remove volumes, and downsize oversized disks. Track storage savings and ensure snapshots and volumes do not accumulate unnoticed costs.
7. Reduce Cross-Zone Traffic and Fix Kubernetes Network Inefficiencies
Cross-zone traffic is one of the most common hidden cloud costs. You may not notice chatty microservices generating gigabytes of inter-AZ traffic.
How to do it:
- Topology-aware routing: Apply it so requests prefer same-AZ pods, only crossing zones when necessary.
- Optimize microservices: Review payload sizes and move chatty APIs to gRPC; measure payload reductions using real traffic with Envoy stats.
- Tune Istio: Disable unnecessary mTLS, telemetry, or tracing in internal-only services to avoid duplicate traffic through sidecars.
- Use internal load balancers: Ensure all East-West traffic uses internal LBs and restrict external LBs to true ingress paths.
- Validate: Check reduced inter-AZ GB transfer, lower LB data processed charges, and improved p95 latency for chatty services.
Tip: Enable topology-aware routing, use internal load balancers, and optimize microservices to reduce inter-AZ data transfer. Measure latency and traffic reductions to confirm cost savings and better network performance.
After learning strategies to reduce costs, it’s helpful to look at scaling approaches that maximize Kubernetes efficiency.
Also Read: Detect Unused & Orphaned Kubernetes Resources
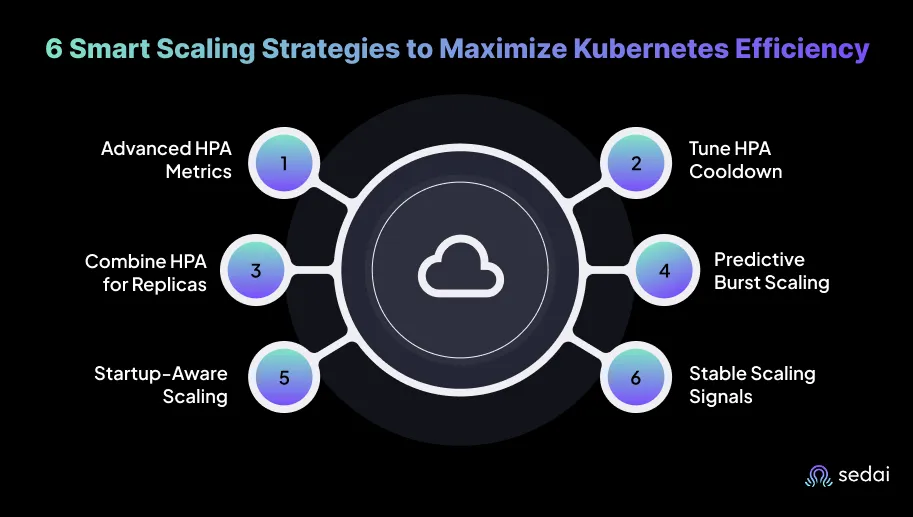
6 Smart Scaling Strategies to Maximize Kubernetes Efficiency
Effective scaling depends on using the right signals and preventing reactive behavior that wastes compute. You can improve efficiency by tuning HPA, VPA, and cluster autoscaling so your workloads scale based on real demand instead of transient spikes.

These strategies help you correct the patterns that cause unnecessary replicas, slow scale-down, and node churn.
1. Use CPU + Custom Metrics for HPA Instead of CPU Alone
Add metrics like requests-per-second, queue depth, or p95 latency to HPA through Prometheus Adapter so your scale-outs reflect real workload pressure, not just CPU noise. Configure stabilization windows and metric averaging so GC spikes or short CPU bursts don’t trigger replica inflation for you.
Tip: Combine multiple custom metrics to create a composite signal for scaling decisions. Periodically validate metrics to avoid false triggers caused by outliers or sudden spikes.
2. Tune HPA Cooldown and Stabilization Settings
Increase the scale-down stabilization window to stop replicas from dropping immediately after a temporary dip in traffic. Reduce the scale-up cooldown so HPA reacts faster to sustained load without overshooting, helping you keep scaling predictable.
Tip: Adjust cooldowns based on workload variability; more volatile workloads may need longer stabilization. Log scale events to analyze whether cooldowns match observed traffic patterns.
3. Combine HPA for Replicas and VPA for Base Sizing
Run VPA in recommendation-only mode to generate accurate CPU and memory requests, then apply those values manually during low-traffic windows. Let HPA manage real-time replica counts based on your updated requests so scaling stays predictable for you.
Tip: Use VPA recommendations to proactively adjust resources before traffic spikes are identified. Review recommendations weekly to ensure they reflect recent workload changes.
4. Use Predictive Autoscaling for Burst-Heavy Workloads
Enable predictive scaling (AWS, GKE, or ML-driven tools) for workloads with clear hourly or daily patterns so replicas come online before traffic hits. Use historical traffic curves to decide how far ahead to pre-scale, helping you avoid cold starts and node churn.
Tip: Feed seasonal or event-driven traffic data into predictive models for better accuracy. Adjust pre-scaling thresholds based on historical performance confidence levels.
5. Align Scaling Policies With Container Startup Time
Increase HPA’s scale-up step size for containers that take 20–60 seconds to initialize so replicas appear before queues build up. For fast-starting services, reduce the step size so scaling stays smooth and doesn’t overshoot, giving you consistent performance.
Tip: Monitor pod startup logs to identify bottlenecks that are slowing scaling. Optimize initialization scripts or dependency loading to reduce startup delays.
6. Reduce Scaling Noise by Filtering Transient Spikes
Increase metric averaging windows to smooth out CPU bursts from GC, JIT warmups, or short-lived processing spikes. Add custom metrics that represent real load signals so HPA doesn’t react to momentary fluctuations, helping you maintain stable scaling behavior.
Tip: Tune metric averaging windows dynamically as workload behavior changes. Use percentile-based metrics (p90, p95) instead of raw values to avoid overreaction to spikes.
Once scaling strategies are in place, you can apply advanced techniques to allocate Kubernetes resources more intelligently.
5 Advanced Techniques for Smarter Resource Allocation
Advanced resource allocation requires tuning workloads based on real runtime behavior rather than static guesses. You can improve both efficiency and reliability by using techniques that adjust resources dynamically and anticipate demand before pressure builds.
These methods work best in clusters where your workloads shift frequently or traffic patterns are unpredictable.
1. Use ML-Driven Rightsizing to Set Accurate Requests
You can export multi-week CPU and memory usage from Prometheus or Datadog, then feed that data into an ML model or ML-enabled optimizer to generate stable request values that match real demand.
Apply these requests during low-traffic windows and confirm that p95 latency, throttling, and memory pressure stay within acceptable thresholds after rollout.
Tip: Validate ML-generated requests against live workload performance for safety. Continuously retrain models with fresh usage data to maintain accuracy over time.
2. Apply Reinforcement-Learning-Based Autoscaling for Unpredictable Workloads
You can connect your real-time workload metrics to an RL-based autoscaler so it adjusts CPU, memory, and replica counts based on observed workload behavior instead of static thresholds.
Test the RL policy on a mirrored workload or a non-critical service first, then roll it out incrementally to avoid sudden scaling swings.
Tip: Start with low-impact workloads to minimize risk and observe RL behavior under real traffic. Adjust reward functions to prioritize both cost savings and performance stability.
3. Use Adaptive Node Provisioning for Better Bin-Packing
You can separate workloads by CPU-to-memory ratio and assign each group to node pools sized for their specific resource shape to reduce fragmentation.
Rebalance workloads periodically to keep pods packing efficiently, allowing the cluster autoscaler to remove underutilized nodes.
Tip: Periodically simulate workload shifts to test node allocation strategies. Adjust node pool sizes dynamically based on historical bin-packing efficiency metrics.
4. Use Workload Profiles to Tune Resource Policies Per Service Type
You can label services as CPU-bound, memory-bound, bursty, or latency-sensitive using usage data and response characteristics, then create request/limit templates for each category. Reevaluate these profiles every quarter and update the templates when code changes alter workload behavior.
Tip: Maintain a dashboard tracking each profile’s resource consumption and scaling behavior. Update templates whenever new features or microservices are added to maintain alignment.
5. Add Priority Classes to Protect Critical Services
You can create priority classes that rank user-facing workloads above background jobs so they get resources first when nodes are under pressure. Assign low-priority classes to batch and auxiliary workloads so they evict cleanly without risking service degradation.
Tip: Monitor eviction events to ensure critical workloads are never impacted. Adjust priority values when new services are added or old ones are decommissioned to maintain hierarchy integrity.
Must Read: Kubernetes Cost Optimization Guide 2025-26
How Sedai Improves Kubernetes Resource Optimization?

Most Kubernetes optimization efforts stop at dashboards and alerts, leaving teams aware of inefficiencies but unsure how to fix them. Engineers know there is waste, yet fine-tuning these settings manually is time-consuming and often unreliable.
Because static thresholds and occasional reviews fail to capture how workloads actually behave, clusters continue to run with hidden inefficiencies and rising costs.
Sedai changes this by continuously learning real workload patterns, predicting demand shifts, and autonomously adjusting pods, nodes, and configurations as they evolve. By removing manual guesswork and adapting to real-time conditions, Sedai changes Kubernetes into a self-optimizing system that stays efficient on its own.
Here’s what Sedai delivers:
- Pod-level rightsizing and demand prediction: Sedai analyzes CPU/memory usage and dynamically adjusts pod requests and limits to match reality. These optimizations consistently contribute to 30%+ reduced cloud costs without sacrificing performance.
- Workload-aware scaling and scheduling: Sedai identifies where workloads should run and how they should scale to stay efficient. This improves cluster efficiency, enabling 75% improved application performance through fewer throttling events and reduced latency.
- Automated anomaly detection and remediation: Instead of waiting for incidents, Sedai detects emerging issues such as memory pressure, resource starvation, or mis-sized workloads and resolves them before users are impacted. This proactive resolution helps teams achieve 70% fewer failed customer interactions (FCIs).
- Autonomous optimization actions across environments: Sedai performs thousands of tuning actions autonomously, balancing workloads, shifting compute, updating limits, and refining scaling rules. This frees engineers from constant review cycles and drives 6× greater engineering productivity.
- Proven reliability at enterprise scale: Sedai continuously manages optimization for large Kubernetes deployments across AWS, Azure, GCP, and on-prem environments, backed by $3B+ in cloud spend managed for security-sensitive organizations like Palo Alto Networks and Experian.
With Sedai, Kubernetes clusters maintain the right resource footprint automatically, preventing drift and keeping workloads responsive as demand changes. It removes guesswork from rightsizing and scaling, allowing you to focus on development rather than constant performance firefighting.
If you're improving Kubernetes resource efficiency with Sedai, use the ROI calculator to estimate how much you can save by reducing waste and improving performance.
Final Thoughts
Resource optimization does more than reduce cloud costs. It encourages better engineering habits like tracking how workloads change, checking resource settings after every release, and treating performance signals as part of the development process.
When teams follow these habits, Kubernetes becomes easier to run because you stop reacting to problems and start building workloads that scale smoothly from the start.
Sedai supports optimization by learning how each workload behaves and adjusting resources automatically, helping teams stay efficient and stable without spending hours fine-tuning requests and limits.
Take control of Kubernetes resource efficiency by using Sedai to tune workloads in real time, prevent drift, and cut unnecessary cloud spend.
FAQs
Q1. How do I know if my cluster is suffering from resource fragmentation?
A1. You can spot fragmentation when nodes have plenty of CPU and memory overall, but still can’t schedule new pods. This often shows up as pods stuck in a Pending state, even though nodes look underutilized. Comparing pod resource requests with available node shapes usually reveals the problem quickly.
Q2. Can Kubernetes resource optimization improve application latency?
A2. Yes, right-sized CPU and memory reduce throttling and garbage-collection pressure, which directly affect latency. When workloads aren’t competing for resources, request handling becomes more predictable. Teams often see measurable improvements in p95 and p99 latencies after correcting resource sizing.
Q3. How often should engineering teams revisit Kubernetes resource settings?
A3. Resource profiles shift every time new code deploys, dependencies change, or traffic patterns evolve. Reviewing requests and limits every 4–6 weeks keeps workloads aligned with actual usage. Services with frequent changes may need more regular checks.
Q4. Is it risky to reduce CPU and memory requests too aggressively?
A4. Yes, cutting requests too far can trigger throttling or OOMKills if workloads suddenly spike. The safest approach is to size for p90–p95 usage rather than p99. Always validate new values against performance metrics before applying changes cluster-wide.
Q5. How do I check if autoscaling issues are caused by wrong resource requests?
A5. Look for signs like HPA scaling too often, replicas increasing on short CPU bursts, or nodes failing to scale down. These usually indicate oversized or undersized requests. Comparing real CPU and memory usage with request values helps pinpoint mismatches.
.webp&w=3840&q=75&dpl=dpl_8N5gJyctMb8weomVhSxGkhy25E4n)
