Optimizing application performance in the cloud requires understanding how latency, saturation, and scaling behavior evolve under real production traffic. Many performance issues emerge gradually through static sizing, delayed autoscaling, and configuration drift across AWS, Azure, and Google Cloud, often going unnoticed until users are affected. By focusing on tail latency, request behavior, and dependency bottlenecks, engineers can prevent regressions before they turn into incidents. The right mix of cloud tools and disciplined practices helps validate every optimization safely.
Application slowdowns under load are often the first sign that scaling, resource limits, or dependencies are misaligned. Latency rises before errors appear, averages look fine, and users feel the impact. Teams often add capacity, increasing cost without fixing the real blockage.
This pattern is common across AWS, Azure, and Google Cloud. Static sizing, slow autoscaling, and configuration drift let tail latency and saturation grow quietly as traffic changes.
More than 60% of enterprises have introduced automated scaling to minimize unnecessary instance costs, highlighting how critical it is to optimize scaling proactively.
That’s why cloud tools for application performance optimization matter. In this blog, you’ll explore 16 cloud tools for app performance optimization in 2026.
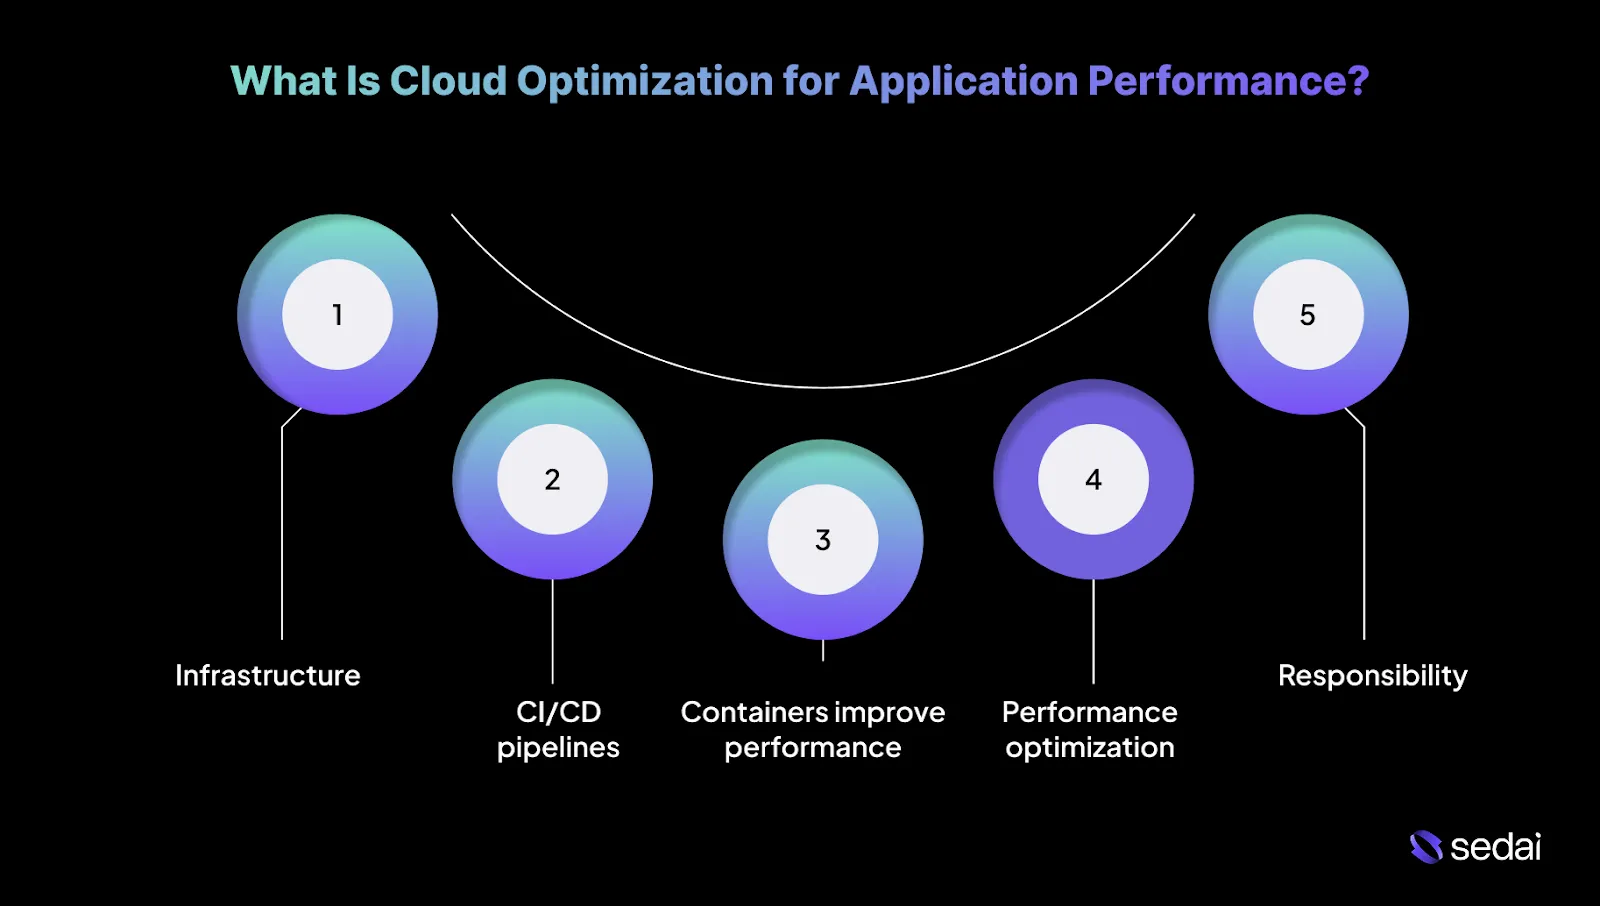
What Is Cloud Optimization for Application Performance?
Cloud optimization for application performance focuses on keeping applications fast and stable as traffic patterns, code paths, and infrastructure change. In cloud environments, performance issues rarely come from a single failure.
Instead, they tend to develop gradually due to static sizing, delayed scaling, and resource drift across AWS, Azure, and Google Cloud services.
Cloud optimization identifies demand by learning traffic patterns and scaling earlier in the request lifecycle. This reduces queue buildup, retry storms, and downstream saturation during sudden load spikes.
Knowing the basics of cloud optimization helps highlight the principles that ensure your applications run efficiently in the cloud.
5 Principles for Optimizing App Performance in the Cloud

Optimizing application performance in the cloud is rarely about a single tuning change. Most issues stem from static sizing, delayed scaling, and configuration drift across AWS, Azure, and Google Cloud as workloads evolve.
These principles focus on how you can keep latency predictable and systems stable under real production traffic.
1. Infrastructure as code removes unpredictability from performance
Manual infrastructure changes introduce inconsistencies, delays, and configuration drift, which eventually manifest as latency variance and hard-to-reproduce regressions.
When environments diverge over time, performance tuning turns into guesswork rather than engineering. This is why infrastructure as code is foundational to performance optimization:
- Infrastructure definitions are versioned and repeatable, keeping staging and production behavior aligned.
- Resource changes such as instance sizes, networking rules, and service dependencies are applied consistently.
- Performance regressions caused by infrastructure drift are easier to trace and roll back.
2. CI/CD pipelines should manage infrastructure
Many teams automate application deployments but still treat infrastructure changes as slow, manual steps. It delays performance fixes and increases the risk of deploying code into poorly tuned environments.
This is why performance-aware teams extend CI/CD to infrastructure:
- Infrastructure changes are validated and deployed through the same pipelines as application code.
- Performance-related configurations ship with every release instead of lagging behind.
- You can respond faster to scaling and latency issues without waiting on manual provisioning.
3. Containers improve performance only when supported by the right services
Containers simplify packaging and deployment, but they do not automatically resolve scaling or performance challenges. Teams often struggle when traditional infrastructure services are applied to containerized workloads without adjustment.
This is why container performance depends on orchestration-aware services:
- Scaling and resource allocation must integrate directly with the container orchestrator.
- CPU- and memory-bound workloads require different handling to avoid noisy-neighbor effects.
- Misaligned services lead to instability, slow scale-ups, and avoidable outages.
4. Performance optimization depends on deep, centralized visibility
In production, failures rarely originate from a single layer. Latency issues often involve a combination of application behavior, infrastructure limits, and network conditions, especially in multi-cloud environments.
This is why centralized visibility is critical for performance optimization:
- You can correlate latency, saturation, and error signals across the entire stack.
- Root causes are identified faster when metrics are not siloed by platform or service.
- Early signs of performance degradation are visible before they escalate into incidents.
5. Performance is a cross-team responsibility
Even with strong tooling, performance degrades when teams work in isolation. Deployment velocity, security controls, network behavior, and infrastructure decisions all shape how systems perform under load.
This is why performance optimization requires shared ownership:
- DevOps, SecOps, NetOps, and platform teams influence scaling and recovery paths.
- Bottlenecks in one workflow affect the entire system.
- Clear ownership and coordination reduce friction during incidents and performance tuning.
Applying these principles is most effective when paired with continuous application monitoring to track performance in real time.
Suggested Read: Optimizing Cloud Storage: Unlocking Cost & Performance Gains with Autonomous Optimization
Why Application Monitoring Is Critical for Cloud App Performance Optimization?
Most cloud performance issues start as tail latency and saturation problems that infrastructure metrics fail to reveal until users are already affected.
Application monitoring delivers the request-level signals engineers need to catch this early and optimize performance safely across AWS, Azure, and Google Cloud workloads.
Here’s how application monitoring is critical for cloud app performance optimization.
- Monitoring validates optimization impact: Before-and-after comparisons using live traffic are the only reliable way to confirm whether a change actually improved performance.
- Monitoring enables safe rollback: Without real-time application signals, engineers cannot confidently reverse an optimization when latency or error rates regress.
- Retries silently amplify load: Application monitoring surfaces retry storms and timeout loops that inflate traffic and worsen latency without obvious infrastructure stress.
- Queue depth reveals scaling failure early: Backlog and queue growth signal saturation much earlier than CPU or memory metrics and indicate when autoscaling will fall behind demand.
- Saturation metrics guide optimization decisions: Thread exhaustion, connection pool limits, and concurrency ceilings show where performance degrades before errors become visible.
- Monitoring turns optimization into a controlled process: Every change is measured, validated, and either retained or rolled back based on observed behavior rather than assumptions.
- Correlation exposes the real choke point: Linking latency and error signals across services clarifies whether the obstacle lies in compute, dependencies, or network paths.
- Verification prevents false savings: Monitoring ensures cost reductions do not come at the expense of slower responses or violated error budgets.
Knowing why monitoring matters helps in choosing the right tools to optimize application performance in the cloud.
16 Top Cloud Tools for Application Performance Optimization
Application performance in the cloud relies on clear visibility, precise control, and rapid action when workloads shift under pressure.
These tools are chosen for their ability to help you pinpoint blockages, verify optimizations, and maintain predictable latency in real production environments. Below are the top cloud tools for app performance optimization.
1. Sedai

Sedai is an autonomous cloud optimization platform built to continuously improve application performance through infrastructure and runtime actions. Rather than observing performance passively, it actively intervenes to prevent degradation before applications are affected.
For application performance optimization, Sedai operates at the resource and configuration layer.
It learns how workloads behave over time, understands service dependencies, and safely executes changes that keep latency low and capacity aligned with actual demand. Engineers do not need to manually tune resources or wait for performance issues to appear.
Sedai continuously evaluates performance and capacity as workloads change. It takes real-time action to keep application performance stable under fluctuating demand.
Key Features:
- Workload Behavior Modeling: Sedai learns normal performance patterns across Azure services under different load conditions. This helps it separate expected variation from real performance risk.
- Dependency-Aware Decision Logic: Before applying any change, Sedai evaluates the impact across dependent services, reducing the risk of optimizations causing instability elsewhere.
- Autonomous Performance Actions: Sedai rightsizes compute, adjusts capacity, and addresses resource-driven blockages without manual intervention, keeping applications aligned with workload demand.
- Safety-First Execution: Changes are applied gradually using learned baselines and guardrails, ensuring improvements do not introduce instability.
- Continuous Optimization Loop: Sedai reassesses performance and capacity in real time as workloads evolve, maintaining alignment as demand patterns shift.
How Sedai Delivers Value:
Best For: Engineering teams running large-scale Azure workloads that need continuous application performance optimization through automated infrastructure actions.
2. AWS CloudWatch

Source
AWS CloudWatch is AWS’s native monitoring service for collecting metrics, logs, and events from AWS resources and applications. It provides foundational performance signals directly from AWS services.
Key Features:
- Service-level metrics: Exposes latency, error rates, and throughput for AWS services
- Custom application metrics: Allows applications to publish performance signals
- Log-derived metrics: Extracts performance indicators from application logs
- Threshold-based alarms: Alerts engineers when defined performance limits are exceeded
Best For: Teams running AWS-native workloads that need direct access to infrastructure- and service-level performance signals.
3. Azure Monitor

Source
Azure Monitor is Microsoft’s unified monitoring platform for Azure infrastructure and services. Application performance visibility is primarily delivered through its Application Insights component.
Key Features:
- Platform metrics collection: Captures performance metrics from Azure resources
- Application Insights tracing: Tracks request latency and external dependencies
- Log Analytics with KQL: Enables deep, query-driven performance analysis
- Alert rules and actions: Triggers responses when performance thresholds are crossed
Best For: Teams operating applications on Azure that require native tools for monitoring application behavior and diagnosing performance issues.
4. Google Cloud Operations

Source
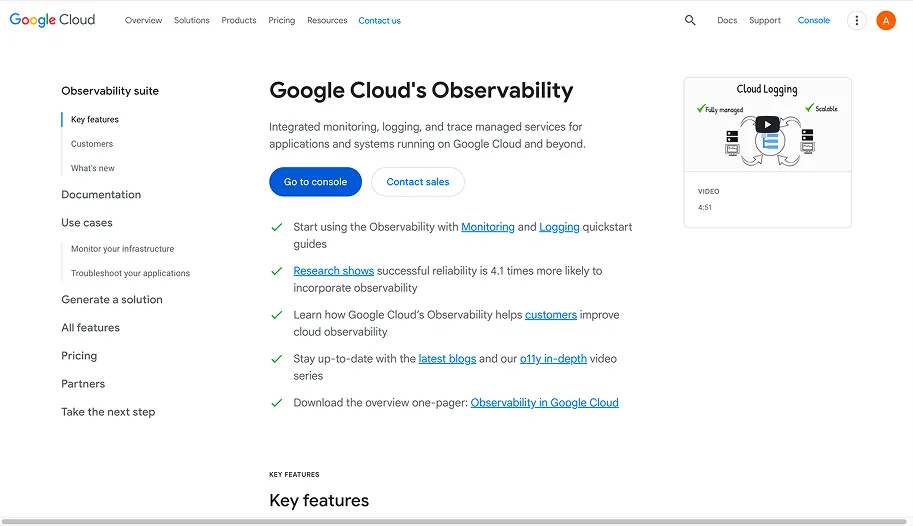
Google Cloud Operations is Google Cloud’s native observability suite for monitoring applications and infrastructure. It provides metrics, logging, tracing, error reporting, and SLO tracking for GCP workloads.
Key Features:
- Managed metrics and logging: Collects performance data from GCP services and workloads
- Distributed tracing support: Tracks request latency across services at a foundational level
- Error reporting: Surfaces application errors that impact performance and reliability
- SLO-based alerting: Monitors performance against defined service objectives
Best For: Teams running applications on Google Cloud that want native monitoring and SLO tracking without deploying third-party tools.
5. Datadog

Source
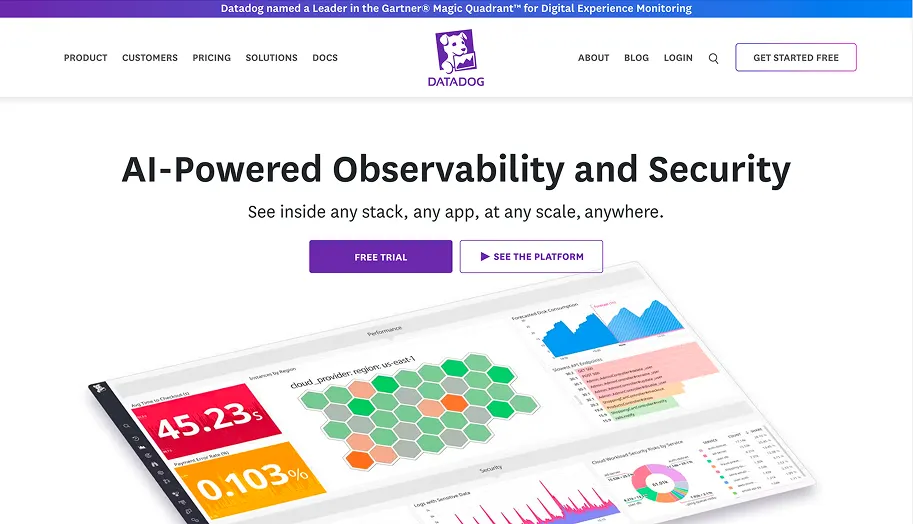
Datadog is a cloud-native application performance monitoring platform designed to correlate application latency with infrastructure behavior in highly dynamic environments. It continuously connects traces, metrics, and runtime context across containers, serverless workloads, and managed cloud services.
Key Features:
- Distributed tracing: Breaks down request latency across services and external calls
- Infra-to-app correlation: Maps application slowdowns to CPU, memory, and network pressure
- Service-level alerting: Triggers alerts when latency, error rates, or saturation cross defined thresholds
- Cloud-native coverage: Natively monitors Kubernetes, serverless, and managed cloud services
Best For: Teams operating large cloud-native systems that need rapid correlation between application performance and underlying infrastructure signals.
6. New Relic

Source
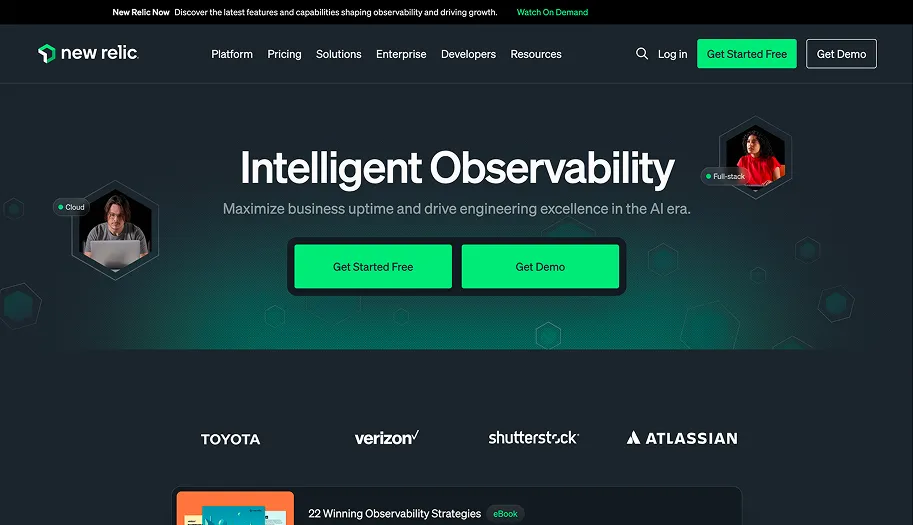
New Relic is a full-stack observability platform with a strong emphasis on understanding how application performance impacts user experience. It captures telemetry across frontend interactions, backend services, APIs, and databases within a unified data model.
Key Features:
- End-to-end transaction tracing: Follows requests from the browser or mobile app through backend services
- Service dependency maps: Visualizes how upstream and downstream services contribute to latency
- User experience scoring: Quantifies performance degradation using Apdex metrics
- Database query insights: Identifies slow queries that affect response times
Best For: Teams optimizing customer-facing applications where latency directly influences engagement and conversion.
7. Dynatrace

Source
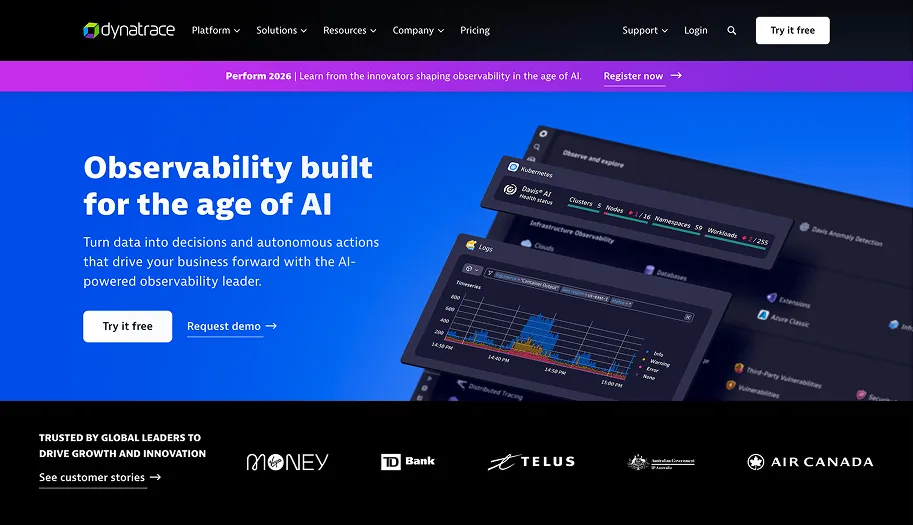
Dynatrace is an AI-driven application performance platform centered on automatic discovery and causal analysis. It continuously maps applications, services, and infrastructure components without requiring manual configuration.
Key Features:
- Automatic topology discovery: Continuously detects services, dependencies, and infrastructure changes
- Causal root cause analysis: Uses AI to identify the precise source of performance issues
- Code-level execution analysis: Surfaces inefficient methods and slow execution paths
- Adaptive baselines: Learns normal behavior to detect meaningful anomalies
Best For: Enterprises running complex distributed systems that require automated root cause detection at scale.
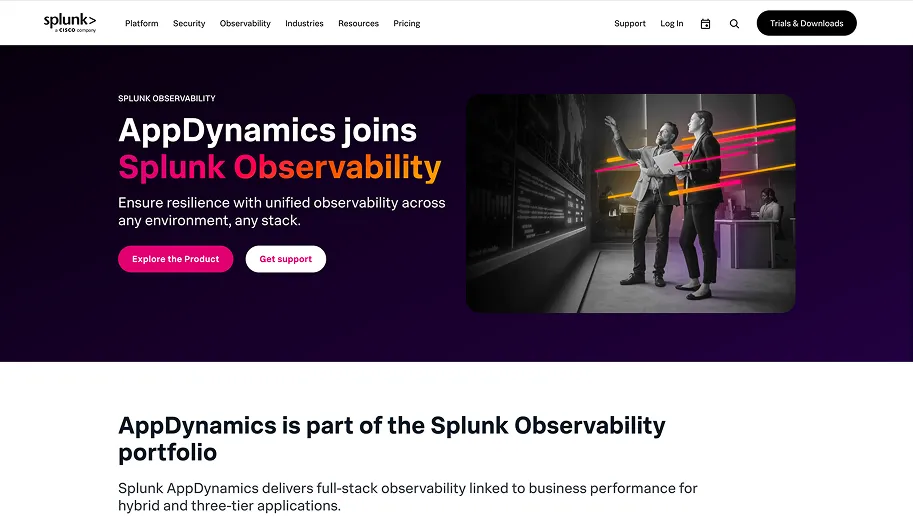
8. AppDynamics

Source
AppDynamics is a transaction-focused application performance monitoring platform designed to track the health of business-critical application flows. It models performance around transactions rather than raw metrics.
Key Features:
- Transaction-level monitoring: Tracks response times across application tiers and services
- Business impact correlation: Associates performance degradation with business outcomes
- Baseline deviation detection: Flags abnormal transaction behavior against learned baselines
- Dependency flow visualization: Shows how tiers and services interact during transactions
Best For: Teams responsible for enterprise applications where performance issues have a direct financial or SLA impact.
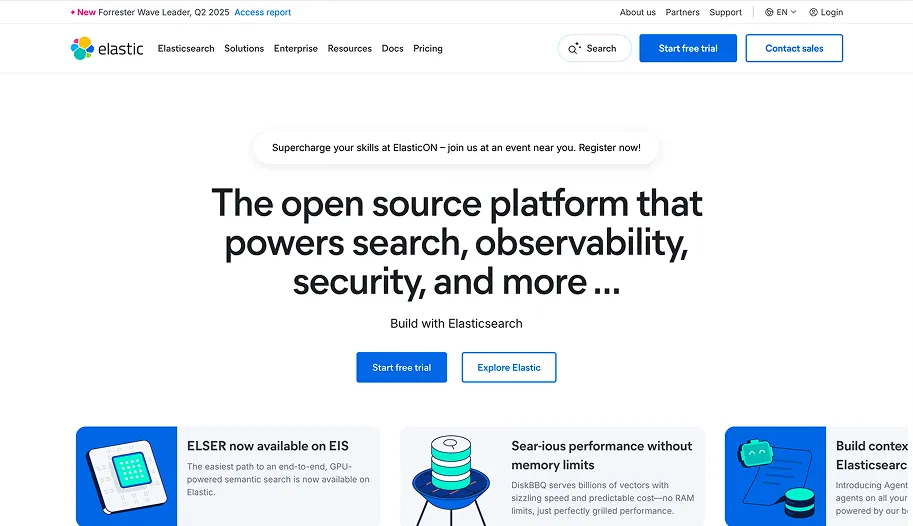
9. Elastic APM

Source
Elastic APM is a developer-centric performance monitoring tool built on the Elastic Stack. It provides deep visibility into application traces and logs while allowing engineers to analyze performance using flexible queries.
Key Features:
- Code-level tracing: Captures execution timing within application runtimes
- Log and trace correlation: Links performance traces directly to relevant log entries
- Custom performance analysis: Enables engineers to query raw performance data using Elasticsearch
- OpenTelemetry compatibility: Supports vendor-neutral instrumentation standards
Best For: Engineering teams that want full control over performance data and prefer hands-on, query-driven analysis workflows.
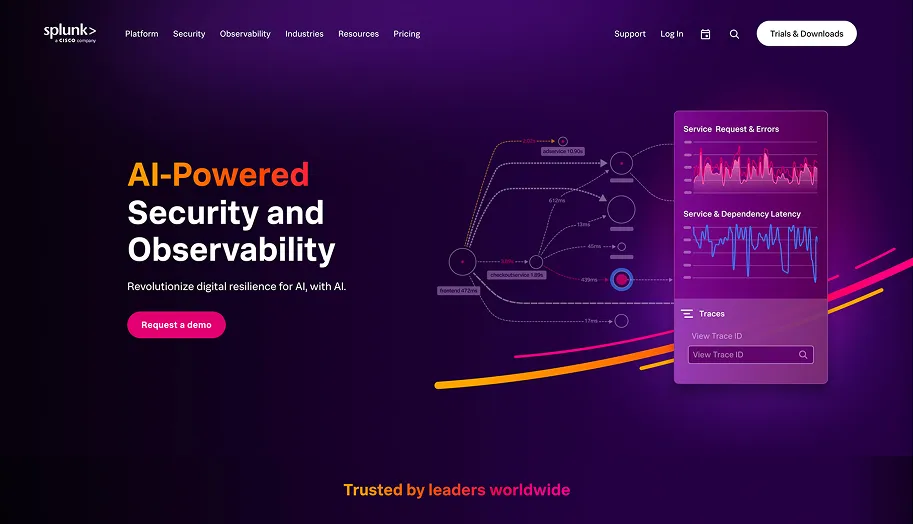
10. Splunk

Source
Splunk provides observability capabilities focused on large-scale analysis of logs, metrics, and traces. It is designed to process high-cardinality telemetry across distributed cloud environments.
Key Features:
- High-volume telemetry ingestion: Handles large-scale logs and metrics from cloud systems
- Performance trend analysis: Identifies recurring latency and error patterns over time
- Cross-service correlation: Connects performance signals across distributed applications
- Advanced diagnostic queries: Enables deep forensic investigation of performance incidents
Best For: Teams diagnosing complex or intermittent performance issues through historical and pattern-based analysis.
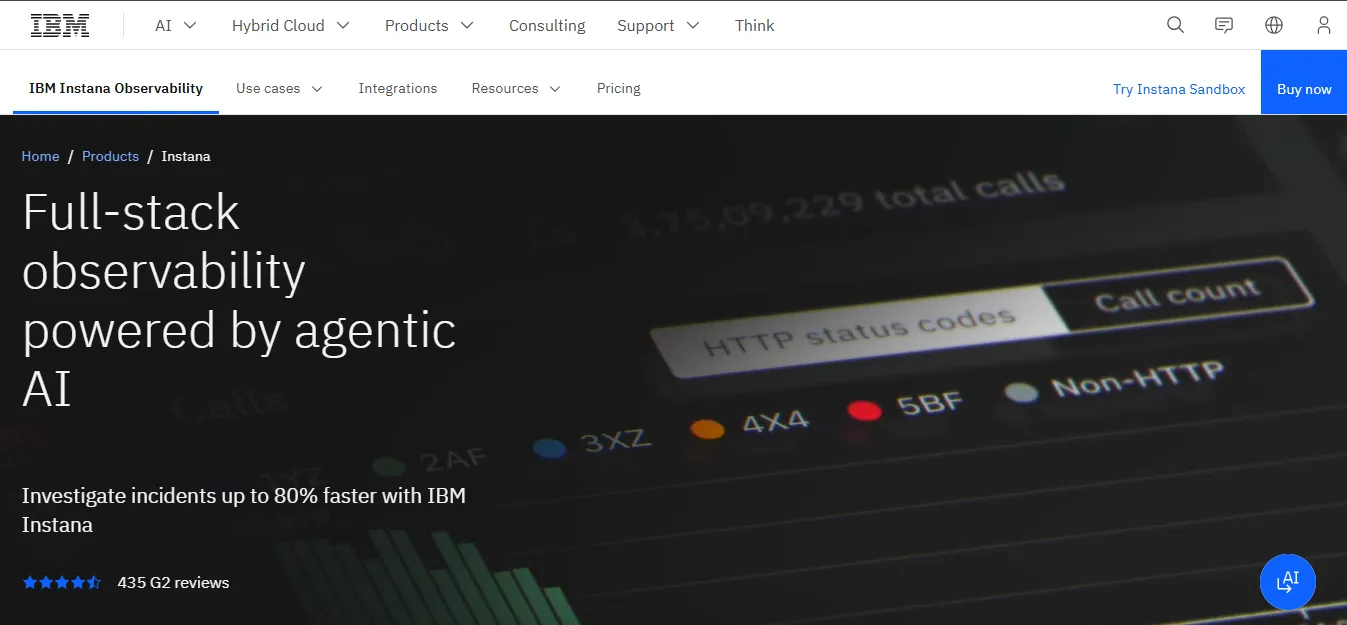
11. IBM Instana

Source
IBM Instana is a real-time application performance monitoring platform built for microservices and containerized workloads. It emphasizes automated instrumentation and immediate visibility.
Key Features:
- Automatic service discovery: Detects services and dependencies without manual setup
- High-frequency metrics collection: Captures near real-time performance signals
- Instant root cause identification: Pinpoints failing services or dependencies quickly
- Kubernetes-native monitoring: Continuously tracks pods, nodes, and services
Best For: Teams running fast-changing microservices architectures that require immediate performance feedback.
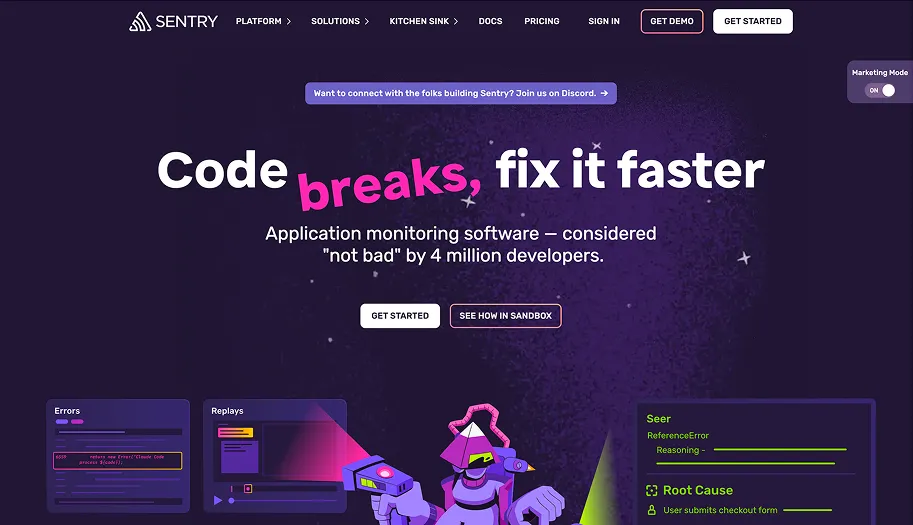
12. Sentry

Source
Sentry is an application-focused monitoring platform that concentrates on code-level errors and performance issues. It operates primarily within the application runtime.
To optimize performance, Sentry helps engineers identify inefficient code paths and regressions introduced by new releases.
Key Features:
- Transaction performance tracing: Breaks down request latency by function and operation
- Release-based comparison: Detects performance regressions after deployments
- Error-performance linkage: Connects runtime errors to slow transactions
- Lightweight instrumentation: Minimizes overhead during monitoring
Best For: Product engineering teams optimizing application performance through targeted code-level improvements.
13. Prometheus

Source
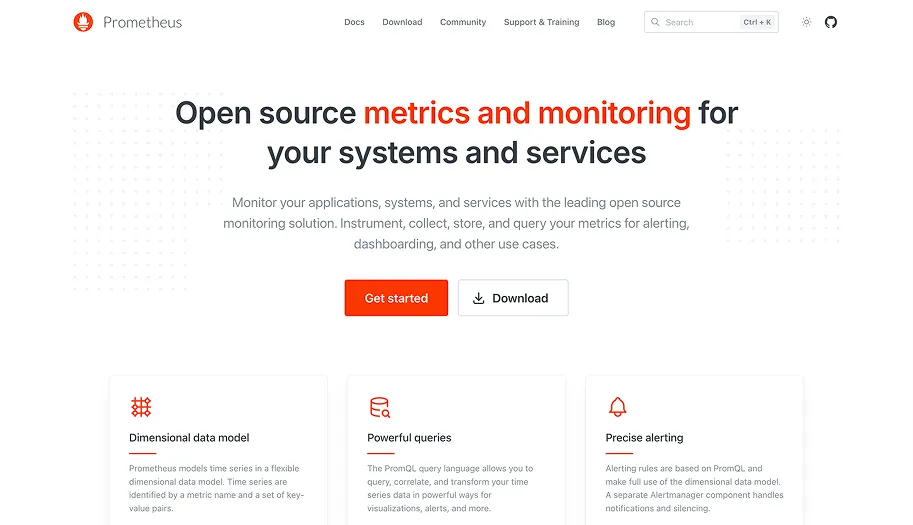
Prometheus is an open-source, metrics-based monitoring system designed for cloud-native environments. It collects time-series metrics using a pull-based model and stores them locally.
Key Features:
- Time-series metrics collection: Stores high-resolution application and system metrics
- PromQL-based analysis: Enables custom latency, throughput, and saturation queries
- Kubernetes service discovery: Automatically tracks dynamic workloads
- Rule-based alerting: Triggers alerts based on metric thresholds and trends
Best For: Teams that want full ownership of performance metrics and prefer building custom optimization workflows.
14. Grafana

Source
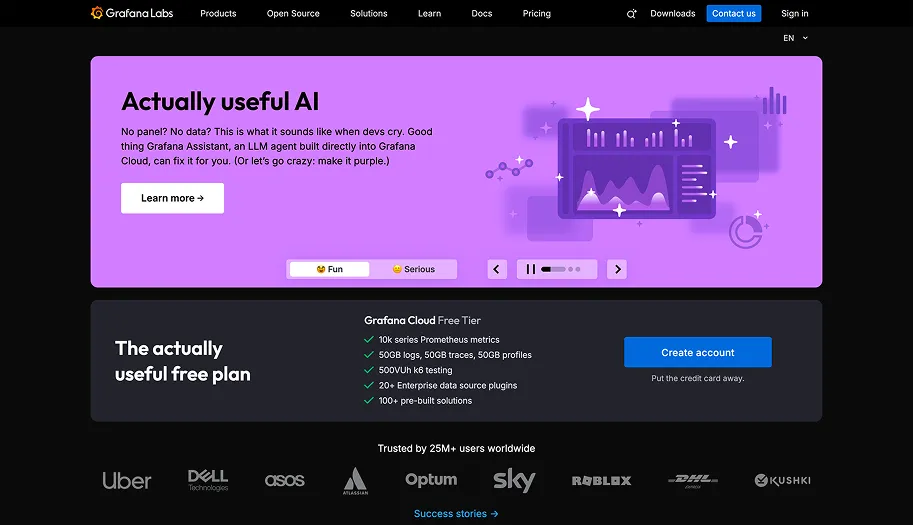
Grafana is a visualization and analytics platform used to explore performance data from multiple observability backends. It focuses on making performance signals readable and actionable.
Key Features:
- Unified performance dashboards: Visualizes metrics, logs, and traces together
- Latency and saturation trends: Highlights long-term performance patterns
- Threshold-based alerting: Fires alerts based on visualized performance data
- Broad data source integration: Connects to most cloud monitoring systems
Best For: Teams that rely on clear, customizable dashboards to guide ongoing performance optimization and capacity planning.
15. Jaeger

Source
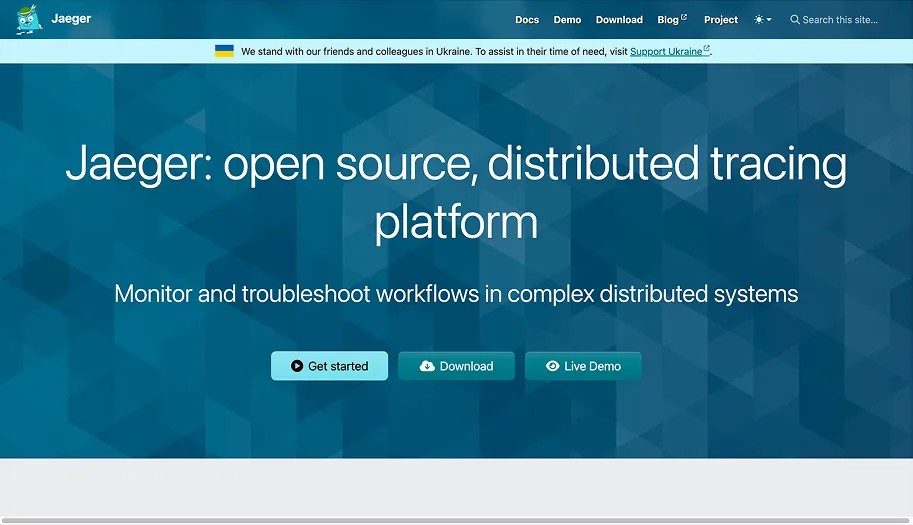
Jaeger is an open-source distributed tracing system designed to trace requests across microservice architectures. It focuses exclusively on trace data and request timing, without collecting metrics or logs.
Key Features:
- End-to-end request tracing: Follows a request across all participating services
- Latency breakdown visibility: Shows time spent within each service and span
- Service dependency visualization: Maps how services interact during a request
- Configurable trace sampling: Controls tracing overhead in high-throughput environments
Best For: Teams diagnosing request latency and service-to-service performance issues in microservices-based cloud systems.
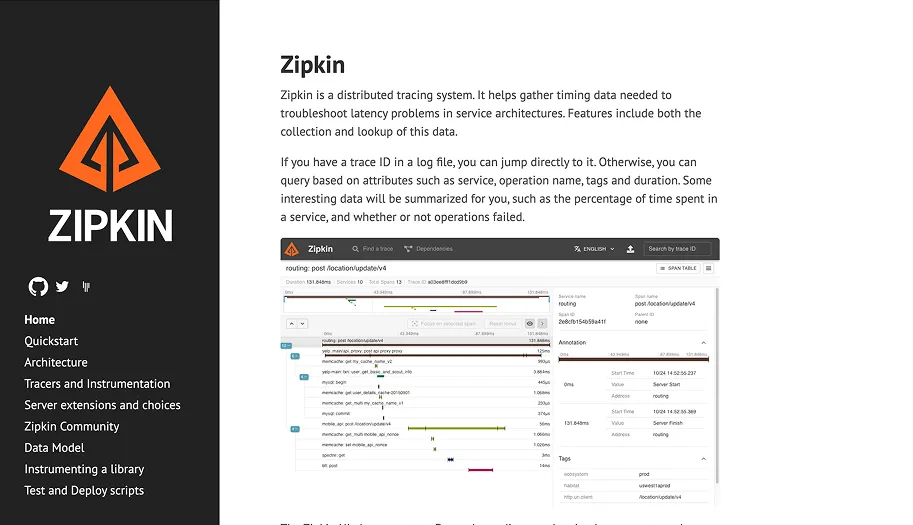
16. Zipkin

Source
Zipkin is a lightweight, open-source distributed tracing system built to collect and visualize span timing data. It prioritizes simplicity and operational ease over advanced analytics.
Key Features:
- Span-based tracing: Captures timing for individual service calls
- Basic dependency graphs: Visualizes service call relationships
- Latency visualization: Highlights slow paths within request traces
- Low operational overhead: Runs with minimal infrastructure requirements
Best For: Teams that need basic distributed tracing to pinpoint latency issues without operating a full observability platform.
Here’s a quick comparison table:
With the right tools in place, following best practices can significantly improve application performance in the cloud.
Also Read: Strategies to Improve Cloud Efficiency and Optimize Resource Allocation
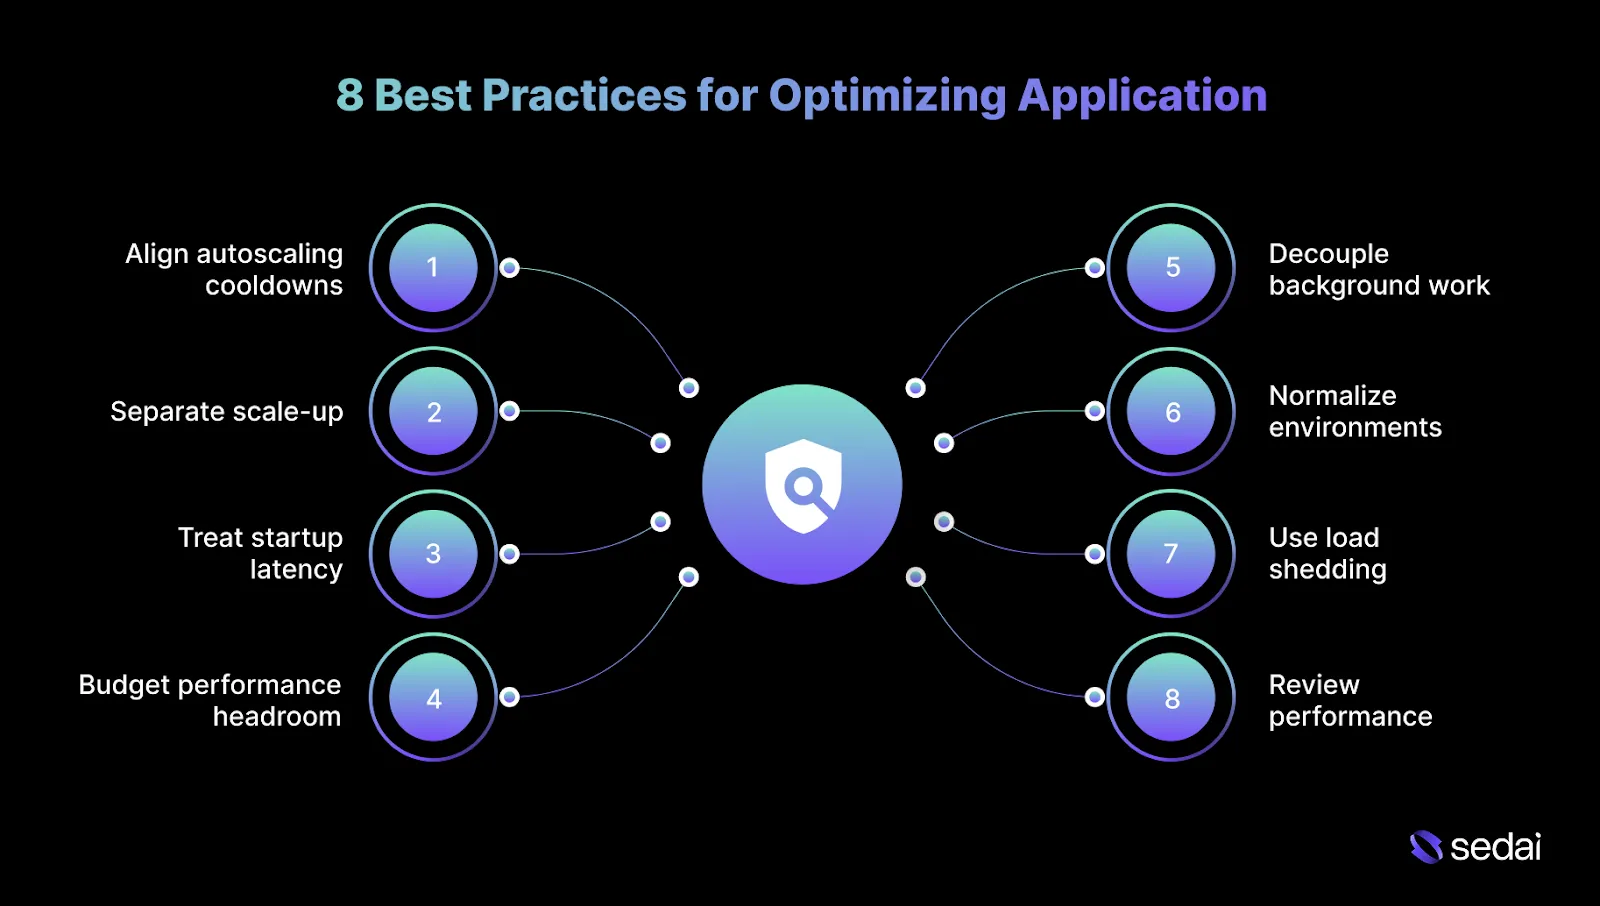
8 Best Practices for Optimizing Application Performance in the Cloud

Optimizing application performance in the cloud requires you to focus on how architecture, scaling policies, and resource allocation behave under real production load. Below are some of the best practices that can help you optimize app performance in the cloud.
1. Align autoscaling cooldowns with application warm-up time
Autoscaling can react quickly, but applications often take longer to become fully ready. When cooldowns and warm-up times are misaligned, systems oscillate, waste capacity, and introduce cold-start latency. Tune scaling behavior using real startup and dependency readiness data.
How to implement:
- Measure container startup, cache warm-up, and dependency initialization times.
- Configure longer scale-down cooldowns to reduce churn.
- Validate scaling behavior under burst traffic.
Tip: Use historical traffic spikes to simulate scale-up/down behavior and validate cooldown configurations under realistic load.
2. Separate scale-up and scale-down strategies
Scaling out too slowly increases latency, while scaling in too aggressively causes thrashing. Applying the same rules in both directions increases instability. Use asymmetric scaling strategies that reflect their different risk profiles.
How to implement:
- Trigger rapid scale-up based on backlog growth or request rate spikes.
- Apply slower, more conservative scale-down policies.
- Observe scaling behavior during traffic decline as well as during growth.
Tip: Periodically review asymmetric scaling thresholds to ensure they still match current traffic profiles and risk tolerance.
3. Treat startup latency as a first-class performance metric
Cold starts and slow initialization dominate latency during traffic ramps. Ignoring startup behavior leads to ineffective scaling events. Measure and optimize startup latency alongside steady-state performance.
How to implement:
- Track time-to-ready metrics for containers and serverless functions.
- Minimize initialization work on request-serving paths.
- Pre-warm capacity ahead of predictable traffic spikes.
Tip: Automate pre-warming or lazy initialization strategies based on predictable peak traffic windows.
4. Budget performance headroom per dependency
Services rarely fail alone. A single slow dependency can exhaust retries and timeouts across multiple services. Allocate performance headroom based on dependency limits.
How to implement:
- Identify the slowest or most fragile downstream dependencies.
- Apply conservative timeouts and concurrency limits around them.
- Re-evaluate headroom after dependency changes or traffic shifts.
Tip: Regularly audit downstream services for latency regressions and adjust headroom to maintain overall system stability.
5. Decouple background work from user request paths
Running background jobs alongside request handling creates hidden contention. Under load, background work competes for resources, increasing latency. Isolate non-user workloads to protect request performance.
How to implement:
- Run background jobs in separate services or execution pools.
- Apply strict CPU and memory limits to asynchronous workers.
- Schedule non-critical jobs during off-peak periods where possible.
Tip: Schedule dependency-heavy or batch processes during low-traffic windows and monitor interference with foreground workloads.
6. Normalize environments before comparing performance metrics
Comparing staging and production metrics without alignment leads to misleading conclusions. Differences in compute types and limits distort results. Normalize environments before using them for performance decisions.
How to implement:
- Match instance types, resource limits, and autoscaling policies across environments.
- Use production-like traffic patterns for validation.
- Treat unaligned environments as functional test setups only.
Tip: Include network latency, storage type, and configuration parity checks when benchmarking staging against production.
7. Use load shedding instead of last-second scaling
Autoscaling cannot recover systems that are already saturated. Controlled degradation preserves core functionality during extreme load. Shed low-priority traffic before saturation cascades.
How to implement:
- Classify requests by priority or business impact.
- Delay or reject non-critical requests when thresholds are crossed.
- Monitor shed traffic to validate thresholds and recovery behavior.
Tip: Implement observability on shed requests to detect patterns and prevent repeated service disruptions.
8. Review performance after feature launches
Many regressions degrade performance gradually and never trigger alerts. Waiting for incidents delays correction. Make post-launch performance review a standard practice.
How to implement:
- Compare latency and error metrics before and after releases.
- Review new dependency calls introduced by features.
- Track gradual performance drift over days.
Tip: Automate post-release metric comparison dashboards to quickly flag slow drifts before they affect users.
Understanding these best practices makes it easier to select the right tools for optimizing cloud application performance.
How to Choose Cloud Tools for App Performance Optimization?
Choosing cloud tools for performance optimization is more about whether the tool helps you understand why an application slows down under real traffic. The right tool makes request behavior, scaling breakdowns, and dependency blockages clear enough to act on confidently.
Here’s how you can choose cloud tools for app performance optimization.
- Start from the failure you are trying to prevent: Choose tools based on whether they help you diagnose the exact classes of issues you encounter in production, such as slow scale-ups, dependency latency, or retry amplification.
- Verify deep support for your actual cloud stack: Confirm the tool understands the specific services you run, such as EKS and Lambda on AWS, AKS on Azure, or GKE on Google Cloud, including their scaling and runtime behavior.
- Check whether the tool preserves context across services: Performance problems rarely stay within a single service boundary. A useful tool makes it clear when the issue originates in a downstream API, database, or queue.
- Evaluate how clearly the tool explains its data: Dashboards should support cause-and-effect reasoning. If additional context is required to understand what the tool shows, it will not hold up under pressure.
- Confirm it supports meaningful comparison: Optimization depends on comparing behavior before and after a change under similar traffic conditions. Tools that only present the current state make it difficult to confirm whether an optimization improved or degraded performance.
- Understand how recommendations are generated: If a tool suggests changes, it must explain the reasoning behind them. Recommendations without visibility into inputs, assumptions, or trade-offs are risky to apply in production.
- Assess how well it fits existing operational workflows: Tools should integrate into CI/CD pipelines, on-call dashboards, and incident response tooling already in use.
- Validate behavior during traffic spikes: Many tools perform adequately under steady load but degrade when traffic surges and retries increase. Evaluate whether data quality and visibility remain reliable during peak conditions.
In practice, teams often look for tools that combine cloud-native visibility with clear explanations of scaling and performance behavior under real traffic.
For example, platforms such as Sedai focus on correlating production signals with optimization decisions, which reflects the broader shift toward explainable performance optimization rather than black-box tuning.
Must Read: Cloud Cost Optimization 2026: Visibility to Automation
Final Thoughts
Optimizing application performance in the cloud is not a one-time tuning exercise. From understanding request behavior and dependency latency to selecting the right monitoring and tracing tools, high-performing teams treat performance as a continuous engineering discipline.
As applications scale across AWS, Azure, and Google Cloud, manual tuning becomes challenging to sustain. This is why more engineering teams are adopting autonomous optimization.
By continuously learning workload behavior, evaluating risk before every change, and safely adjusting live infrastructure, platforms like Sedai help maintain stable performance without waiting for alerts or user complaints.
The result is a self-optimizing production environment: latency remains predictable, capacity aligns with actual demand, and engineers spend less time firefighting and more time building.
Take control of performance drift early to keep your applications fast and reliable as they grow.
FAQs
Q1. Can application performance optimization increase cloud costs in some cases?
A1. Yes, performance optimization can increase costs when you deliberately add capacity to protect latency-sensitive paths or reduce failure risk. In these cases, higher spend reflects intentional reliability and user experience choices.
Q2. How do you decide which performance issues are worth fixing?
A2. Prioritize issues that affect tail latency, error rates, or customer-facing workflows under real production traffic. Problems that appear only in synthetic tests or low-impact paths rarely justify aggressive optimization.
Q3. Do performance optimizations need to be revisited after every release?
A3. Yes. New features, dependencies, and traffic patterns routinely invalidate previous tuning decisions. Optimizations that are not revalidated over time become drift and hidden risk.
Q4. How early should performance optimization start in a project?
A4. Performance optimization should begin once realistic traffic patterns exist. Optimizing too early locks in assumptions that almost never survive first contact with production.
Q5. Can performance tooling replace good system design?
A5. No, performance tooling fastens up detection and diagnosis, but it cannot compensate for a weak architecture. Clear service boundaries, dependency isolation, and backpressure remain essential for predictable performance.

