What problem does Sedai solve for GPU optimization in Kubernetes?
Sedai addresses the challenge of accurately measuring and optimizing GPU utilization in Kubernetes environments. Traditional metrics like nvidia-smi can be misleading, often showing high utilization even when GPUs are underused. Sedai's approach synthesizes multiple hardware-level metrics to identify real inefficiencies, enabling safe, autonomous right-sizing of GPU resources and reducing waste—potentially saving up to $70,000 per GPU per year at current H100 rates (2025 survey).
Why is nvidia-smi GPU utilization not a reliable metric for optimization?
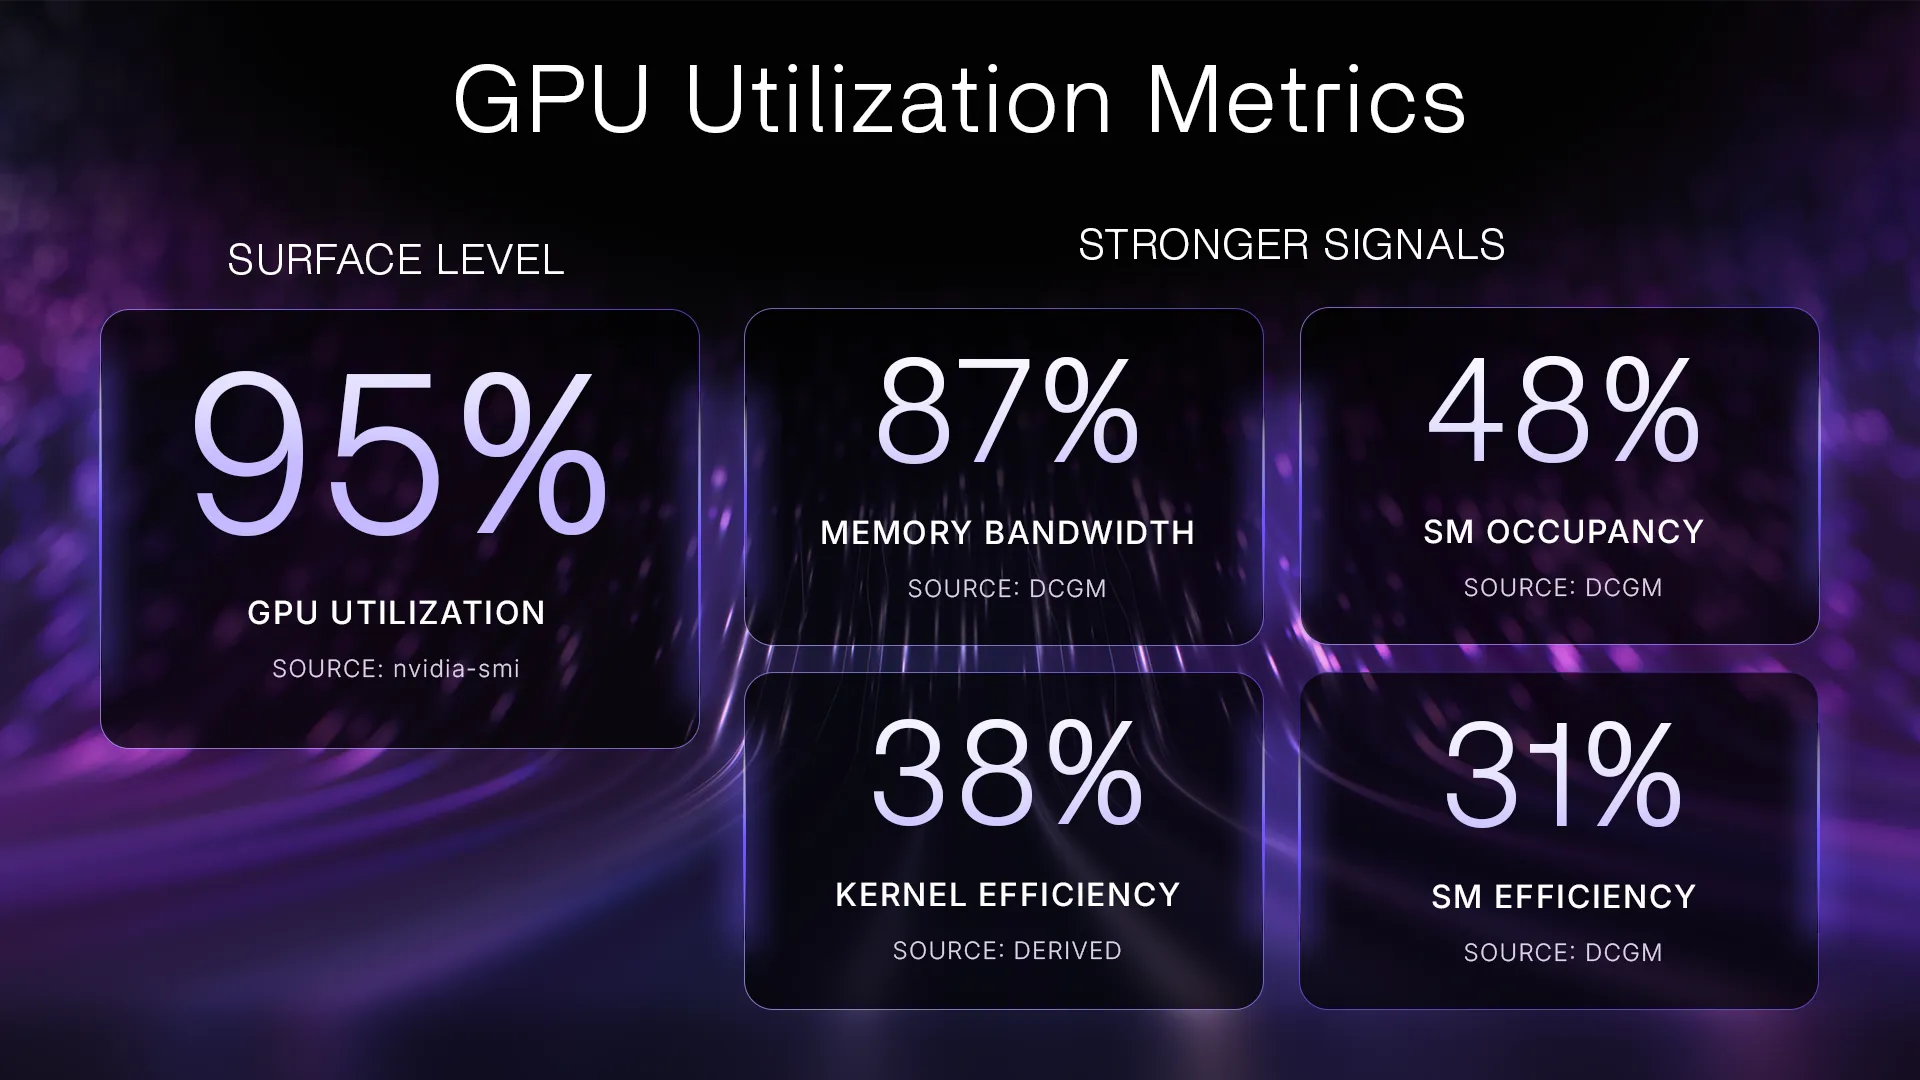
The nvidia-smi tool reports whether the GPU is active, not how efficiently it's being used. A workload can keep utilization at 95% simply by occupying the GPU, even if it's only using a fraction of its compute capacity. This can mask significant inefficiencies and lead to wasted resources. Sedai's solution goes beyond this by analyzing memory bandwidth, SM efficiency, SM occupancy, and kernel efficiency for a true utilization picture.
How does Sedai measure real GPU utilization in Kubernetes?
Sedai synthesizes multiple hardware-level metrics—such as memory bandwidth, SM efficiency, SM occupancy, and kernel efficiency—to estimate true GPU utilization. By running controlled CUDA workloads and analyzing patterns across different workload types (compute-bound, memory-bound, etc.), Sedai's algorithm learns to distinguish between productive and wasted GPU activity, enabling accurate optimization decisions.
What is the impact of inefficient GPU utilization in Kubernetes environments?
Inefficient GPU utilization can result in significant financial waste. For example, a single GPU running at 30% utilization can waste around $70,000 per year at current H100 rates. Standard monitoring tools often fail to surface these inefficiencies, making it difficult for teams to optimize costs and performance without advanced solutions like Sedai.
How does Sedai right-size GPU allocation in Kubernetes?
Sedai uses NVIDIA's Multi-Instance GPU (MIG) technology to partition physical GPUs into isolated slices with dedicated memory and compute. Sedai creates ResourceClaimTemplates for each workload class, patches pods to claim the appropriate slice, and efficiently packs multiple workloads onto a single GPU. Sedai also supports AWS fractional GPU instances (G6F), which handle partitioning at the hypervisor level.
What are the limitations of current GPU partitioning methods in Kubernetes?
MIG partitions are static and must be defined in advance, while traffic and workload patterns are dynamic. Dynamic Resource Allocation (DRA) in Kubernetes aims to address this but is not yet production-ready. As a result, partition configurations must be managed manually when workload patterns shift, and dynamic scaling of GPU slices is not yet possible.
How does Sedai validate its GPU optimization algorithms?
Since there is no industry standard for GPU utilization, Sedai builds per-application models by observing healthy and inefficient patterns for each workload type. The platform learns from every optimization action it takes, feeding outcomes back into the system to continuously improve accuracy and effectiveness.
Does Sedai support both NVIDIA MIG and AWS fractional GPU instances?
Yes, Sedai supports both NVIDIA Multi-Instance GPU (MIG) for partitioning physical GPUs into slices and AWS fractional GPU instances (G6F), which handle partitioning at the hypervisor level. This flexibility allows Sedai to optimize GPU resources across different cloud and hardware environments.
What is Dynamic Resource Allocation (DRA) in Kubernetes, and how does Sedai use it?
Dynamic Resource Allocation (DRA) is a Kubernetes construct that manages scheduling of GPU slices on top of MIG. While promising, DRA is still in early adoption and not fully production-ready. Sedai is actively exploring DRA to enable more dynamic GPU partitioning as the technology matures.
What challenges remain unsolved in GPU optimization for Kubernetes?
Dynamic GPU partitioning—where MIG slices expand and contract automatically based on traffic—is not yet possible due to hardware and software limitations. The GPU infrastructure landscape is rapidly evolving, and solutions must adapt to new hardware generations, ML frameworks, and Kubernetes primitives. Sedai continues to innovate as these technologies mature.
How does Sedai ensure safety when making autonomous optimizations in production?
Sedai is the only cloud optimization platform patented for safe, autonomous optimizations in production. It never causes incidents or breaches SLOs by making slow, gradual changes with continuous validation checks. Unlike risky optimizers that make all-at-once changes, Sedai's safety-by-design approach includes health verification, automatic rollbacks, and incremental updates to ensure reliability and trust.
How does Sedai's approach to GPU optimization differ from traditional tools?
Traditional tools rely on static metrics and manual intervention, often missing real inefficiencies. Sedai uses application-aware intelligence, synthesizing multiple hardware signals and learning from each optimization. Its patented safety-first, autonomous approach ensures optimizations are always safe and effective, even in production environments.
Can Sedai's GPU optimization be used in production environments?
Yes, Sedai's GPU optimization is designed for production use. Its safety-by-design features, including continuous health verification and automatic rollbacks, ensure that optimizations do not cause incidents or breach SLOs. Sedai is trusted by leading organizations for safe, autonomous cloud optimization in live environments.
How can I see Sedai's GPU optimization in action?
You can schedule a demo with Sedai to speak with a technical expert and see how Sedai autonomously optimizes Kubernetes GPU workloads in production. Visit sedai.io/demo to book a session.
Where can I learn more about Sedai's GPU optimization technology?
For a deeper dive into Sedai's GPU optimization, read the blog post "GPU Optimization Launch" by Ethan, or listen to the 1 IDEA podcast featuring Sedai's engineering team.
Is Sedai's GPU optimization available now?
Yes, Sedai's GPU optimization is available for use. You can stop guessing at GPU utilization and schedule a demo to see how it works in your environment by visiting sedai.io/demo.
How does Sedai's GPU optimization adapt to new hardware and frameworks?
Sedai's optimization algorithms are designed to learn from each action and outcome, allowing them to adapt as new GPU hardware generations, ML frameworks, and Kubernetes primitives emerge. The platform continuously revalidates its measurement and optimization models to stay effective as technology evolves.
What is the role of memory bandwidth in GPU optimization?
Memory bandwidth is a critical factor in GPU performance. Many workloads are memory-bound, meaning the GPU spends time waiting for data transfers rather than performing computations. Sedai's optimization considers memory bandwidth alongside compute metrics to accurately identify and resolve bottlenecks.
How does Sedai handle different workload types (training, inference, batch jobs) in GPU optimization?
Sedai's algorithm recognizes unique metric patterns for different workload types, such as training, inference, and batch jobs. By learning these patterns, Sedai can tailor optimizations to the specific needs and behaviors of each workload, ensuring efficient and effective GPU usage.
Features & Capabilities
What features does Sedai offer for cloud and GPU optimization?
Sedai provides autonomous optimization for cloud resources, including GPUs, containers, serverless, and VMs. Key features include application-aware intelligence, proactive issue resolution, full-stack cloud coverage, safety-by-design, release intelligence, and plug-and-play implementation. Sedai integrates with Kubernetes, AWS, Azure, GCP, and supports NVIDIA MIG and AWS fractional GPUs.
Does Sedai integrate with existing monitoring and CI/CD tools?
Yes, Sedai integrates with popular monitoring and APM tools like Prometheus, Datadog, Cloudwatch, and Azure Monitor, as well as CI/CD platforms such as GitHub, GitLab, Bitbucket, and Terraform. It also connects with ITSM tools like ServiceNow, PagerDuty, and Jira, ensuring seamless workflow integration.
What security and compliance certifications does Sedai have?
Sedai is SOC 2 certified, demonstrating adherence to stringent security and compliance standards for data protection. For more details, visit the Sedai Security page.
How quickly can Sedai be implemented in my environment?
Sedai offers a plug-and-play implementation process. Initial onboarding takes approximately 15 minutes for agentless or agent-based deployment. Additional setup for integrations may require more time depending on your environment's complexity.
What technical documentation is available for Sedai?
Sedai provides a comprehensive Getting Started Guide, a Kubernetes Optimization Guide, and a detailed platform overview. These resources are available at docs.sedai.io/get-started and sedai.io/resources.
Pricing & Plans
What is Sedai's pricing model?
Sedai uses a volume-based pricing model, charging based on the specific resources optimized (e.g., Kubernetes pods, ECS tasks, VMs). Pricing is transparent, flexible, and adapts to your usage. A free tier and a 30-day free trial are available. For Kubernetes environments, Sedai recommends booking a demo to discuss your needs. See Sedai's pricing page for details.
Use Cases & Benefits
What business impact can I expect from using Sedai for GPU optimization?
Customers using Sedai typically achieve up to 50% cloud cost reduction, 75% latency reduction, and 6X productivity gains. For example, KnowBe4 saved $1.2 million on AWS costs, and Palo Alto Networks saved $3.5 million. Sedai's autonomous optimization delivers measurable ROI, often with payback in under six months and ROI greater than 400% (KnowBe4 case study).
Who can benefit from Sedai's GPU optimization?
Sedai's GPU optimization is ideal for IT/cloud operations, FinOps, technology leadership, platform engineering, and SRE teams in industries such as cybersecurity, financial services, healthcare, e-commerce, IT, and consumer goods. It addresses challenges like cost control, operational toil, performance, and compliance.
What pain points does Sedai address for GPU and cloud optimization?
Sedai addresses pain points such as cloud spend pressure, risk and compliance concerns, operational toil, ticket volume, configuration drift, and the gap between monitoring and action. It automates optimization, reduces manual work, and ensures safe, compliant changes.
What are some real-world success stories with Sedai?
KnowBe4 achieved 50% cost savings and saved $1.2 million on AWS, Palo Alto Networks saved $3.5 million, Belcorp reduced AWS Lambda latency by 77%, and Campspot achieved a 34% reduction in latency. See more at sedai.io/customers.
Competition & Comparison
How does Sedai compare to other cloud optimization platforms?
Sedai stands out as the only patented platform for safe, autonomous optimization in production. Unlike competitors that rely on static recommendations or manual intervention, Sedai makes gradual, validated changes with continuous health checks, ensuring no incidents or SLO breaches. Its application-aware intelligence and full-stack coverage provide a holistic, proactive solution.
What makes Sedai's approach safer than other optimizers?
Sedai's patented safety-by-design approach ensures all optimizations are incremental, continuously validated, and automatically rolled back if issues are detected. This minimizes risk and builds trust, unlike platforms that make all-at-once changes without sufficient safeguards.
Technical Requirements
What technologies does Sedai support for GPU and cloud optimization?
Sedai supports Kubernetes (including NVIDIA MIG and DRA), AWS EKS, ECS, Lambda, EC2, Azure AKS, GCP, and AWS fractional GPU instances. It integrates with a wide range of monitoring, CI/CD, and ITSM tools for seamless operation.
Is Sedai suitable for hybrid and multi-cloud environments?
Yes, Sedai provides full-stack cloud coverage and is designed to optimize resources across AWS, Azure, GCP, Kubernetes, and hybrid environments, addressing complexity and ensuring consistent governance and compliance.
Support & Implementation
What support does Sedai offer during onboarding and implementation?
Sedai provides detailed technical documentation, a Getting Started Guide, and access to technical experts for onboarding. The platform is designed for quick, plug-and-play setup with minimal disruption to existing workflows.
How does Sedai ensure ongoing optimization and learning?
Sedai continuously learns from every optimization action and outcome, updating its models to adapt to new workloads, hardware, and frameworks. This ensures ongoing effectiveness and improvement in cloud and GPU optimization.
How We Solved the GPU Optimization Problem for Kubernetes
Benjamin Thomas
CTO
May 28, 2026
Featured
Key takeaways
Eliminate idle GPU resources in Kubernetes clusters to reduce AI infrastructure waste.
Use GPU partitioning to improve utilization across multiple AI and ML workloads.
Optimize Kubernetes scheduling to prevent GPU overprovisioning and resource fragmentation.
Continuously monitor GPU usage patterns to improve performance and cloud efficiency.
This post expands on a conversation I had with Suresh on the 1 IDEA podcast.
Sedai has been autonomously optimizing cloud infrastructure for a while. But when customers started asking about rising GPU costs in 2026, we assumed addressing the problem would be similar to what we already optimize.
We’d identify the inefficiency, right-size the resource, and execute the change.
While the waste is well documented, what wasn’t —as a 2025 ACM study confirmed — is how to measure it accurately enough to fix it. When we talked to GPU experts early in this project, they told us: if you can crack the measurement problem, that's going to be genuinely useful.
Up until now, nobody had. So we built the solution ourselves, starting with a metric we had to stop trusting.
Why nvidia-smi GPU Utilization Is the Wrong Metric
When you run nvidia-smi and check GPU utilization, you might see 95% with no errors in the logs. We pulled that number early on and wrote code against it, but it was completely wrong.
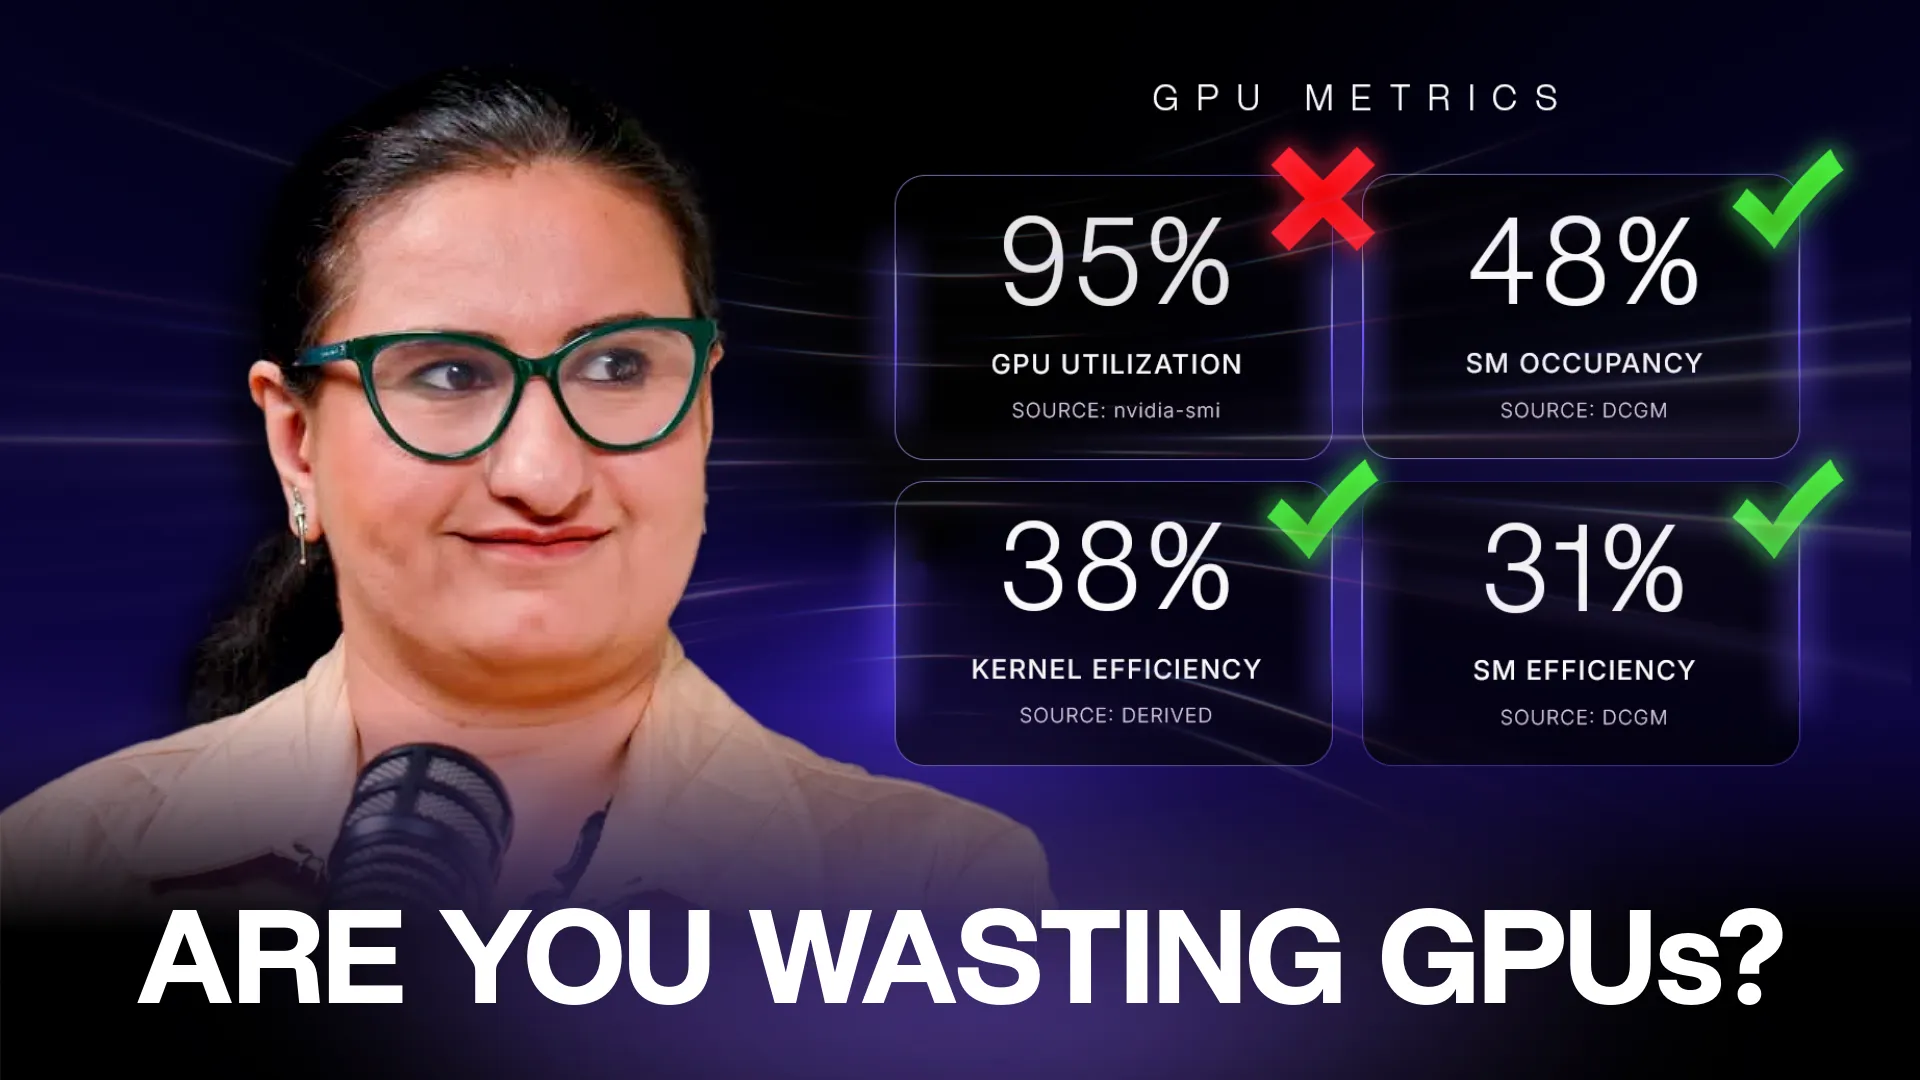
nvidia-smi GPU utilization measures whether the GPU is active, not how efficiently it's being used. A small workload can keep the number at 95% simply by occupying the GPU, even if it's only using a fraction of the available compute capacity.
95% doesn't mean the GPU is nearly full; it simply means the GPU is doing something. And if that's the number you're building your optimization logic on, you'll never find the actual waste.
Running the same workload through nvidia-smi and DCGM side by side shows exactly how misleading the default metric is.
Once we accepted that, we hit the next problem: there's no single metric that replaces it.
You have to synthesize memory bandwidth, SM efficiency, SM occupancy, & kernel efficiency to get anywhere close to a real utilization number. Even then, it's still incomplete.
Most well-optimized GPU workloads can only use 30-40% of what the hardware is actually capable of, and standard monitoring won't surface that gap.
Memory compounds this. While CPUs access system RAM directly, GPUs have their own VRAM on the physical card, and the two pools transfer data over a PCIe link — which is slow.
Because of this, your GPU can sit idle waiting for data while every metric in your dashboard looks healthy. Most teams focus on FLOPS & compute specs. The real bottleneck is often the memory transfer, and it barely registers in standard monitoring.
Starting From the Hardware
Because none of the standard metrics gave us a reliable signal, we couldn't build on top of existing tooling. We had to go down to the hardware itself.
If you're from a CUDA background, when metrics don't make sense, you write controlled programs to understand what they're actually measuring. So, we started by writing the simplest possible CUDA program: a single kernel running one thread on one SM.
The goal was to see exactly how each metric behaved with a known, minimal workload before adding any complexity.
We then increased complexity gradually: a compute-heavy workload, then a memory-heavy workload, then different GPU architectures & conditions. We found that each workload type produces a consistent pattern across the metrics.
A compute-bound workload shows high SM occupancy & high FP32 or tensor core activity, but memory bandwidth stays low. That means the cores are busy crunching numbers and rarely waiting on data.
A memory-bound workload flips that pattern: memory bandwidth saturates while SM occupancy stays moderate, because warps are constantly stalling, waiting for data to arrive from VRAM rather than doing useful math.
The tricky part is that nvidia-smi reports the same 95% utilization for both, since all it measures is whether any kernel was running. It can't tell you whether that kernel was actually doing productive work or just sitting in a memory stall.
Training, inference, & batch jobs each have their own signature. Our algorithm came together by learning to recognize those patterns across many signals rather than relying on any single number.
The Validation Problem
Building the algorithm was hard. Validating it was harder, because there is no industry standard for GPU utilization, and NVIDIA doesn't publish one.
A metric threshold that looks healthy for an LLM training workload will look completely different on an inference workload or a batch job, because each workload type uses the GPU differently. There's no external benchmark to check your work against.
So we built our own. For each application type, we observed patterns: what healthy looks like, what inefficient looks like, & what the early warning signs are.
That per-application model is both how we trained the algorithm and how we verified it. When Sedai fixes an inefficiency, the outcome feeds back into the system so the model learns from every action it takes, and the same diagnostic cycle doesn't repeat.
Ready To Optimize Your GPUs?
Book a Sedai demo to speak with a technical expert.
How We Right-Size GPU Allocation in Kubernetes
Having an accurate utilization picture only matters if you can act on it.
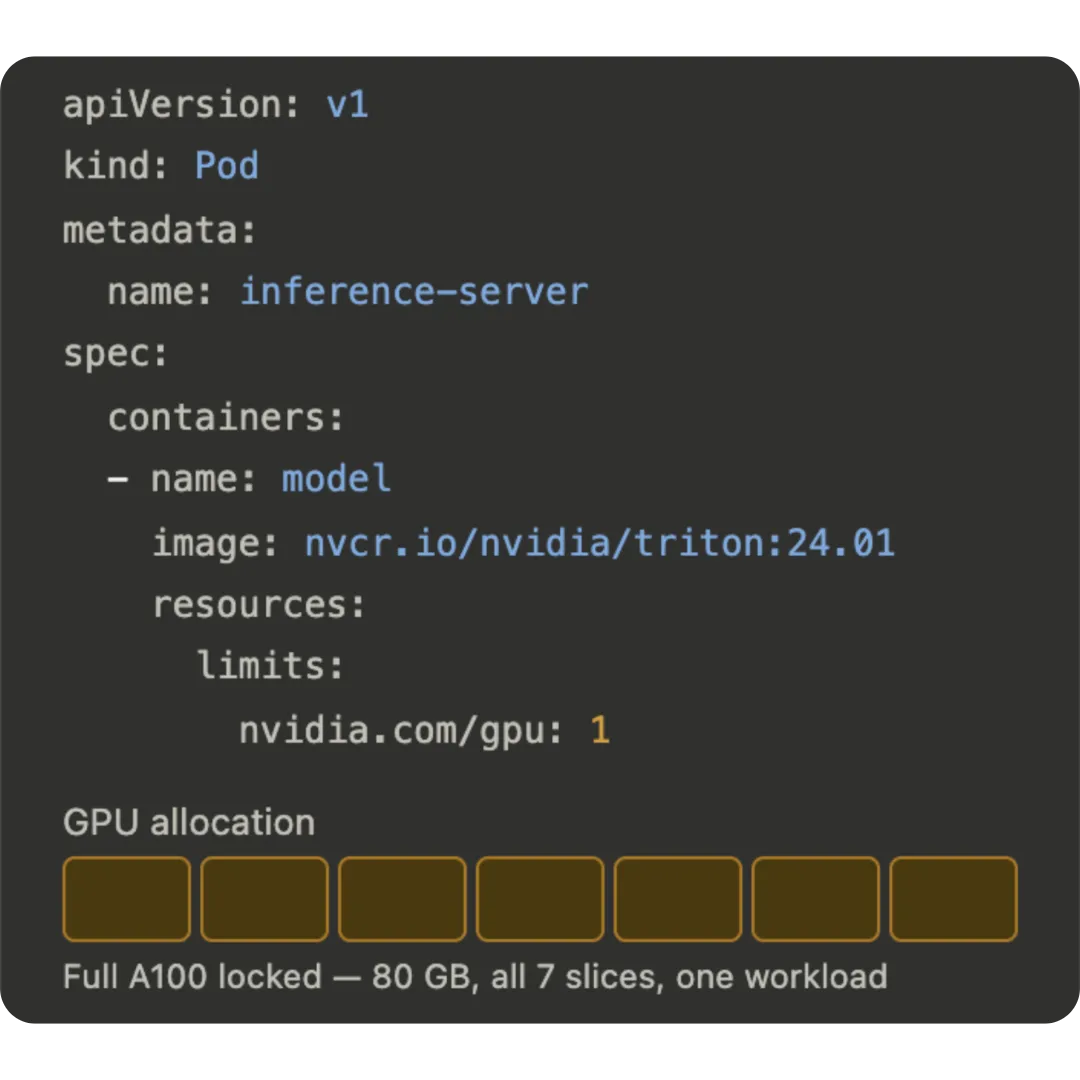
Kubernetes by default treats GPUs as indivisible units. A pod requests nvidia.com/gpu: 1 and gets an entire device regardless of actual need.
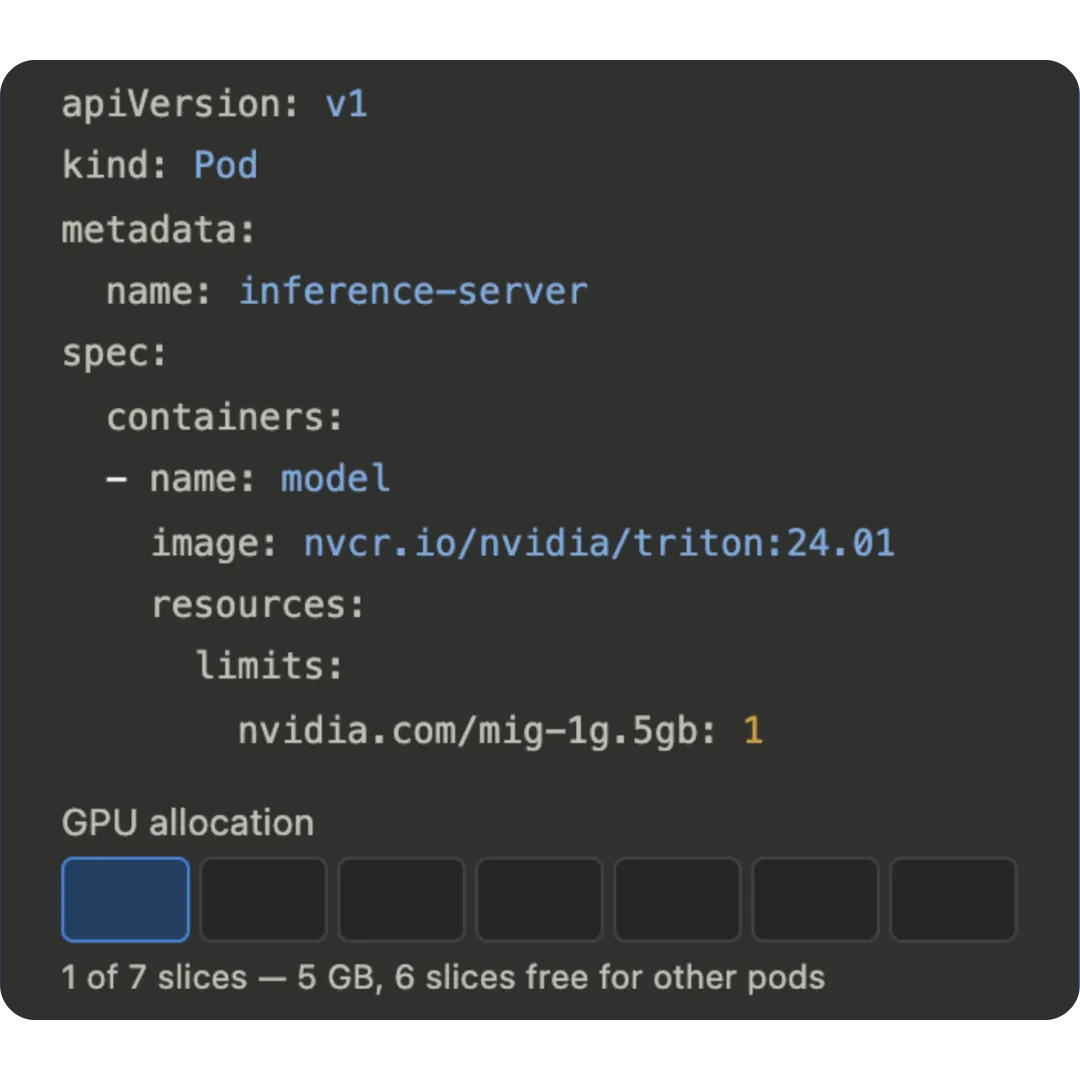
NVIDIA's Multi-Instance GPU (MIG) partitions a physical GPU into isolated slices with dedicated memory and a defined share of compute. An A100 can be split into configurations like 1g.5gb, 2g.10gb, or 4g.20gb.
The constraint is that you're choosing from a predefined menu; you can't just request 37% of a GPU. In practice, teams pick the closest slice size to what their workload actually needs and accept that it won't be a perfect fit.
Time slicing divides GPU time between workloads but provides no memory isolation, so one compute-heavy workload can consume everything, and it's not suitable for production.
Dynamic Resource Allocation (DRA) is a Kubernetes construct that sits on top of MIG and handles scheduling — it decides which predefined slice a workload gets assigned to. It's promising but not fully production ready. We're in the early stages of adoption.
Here’s how Sedai configures MIG partitions on a GPU node and maps workloads to the resulting slices:
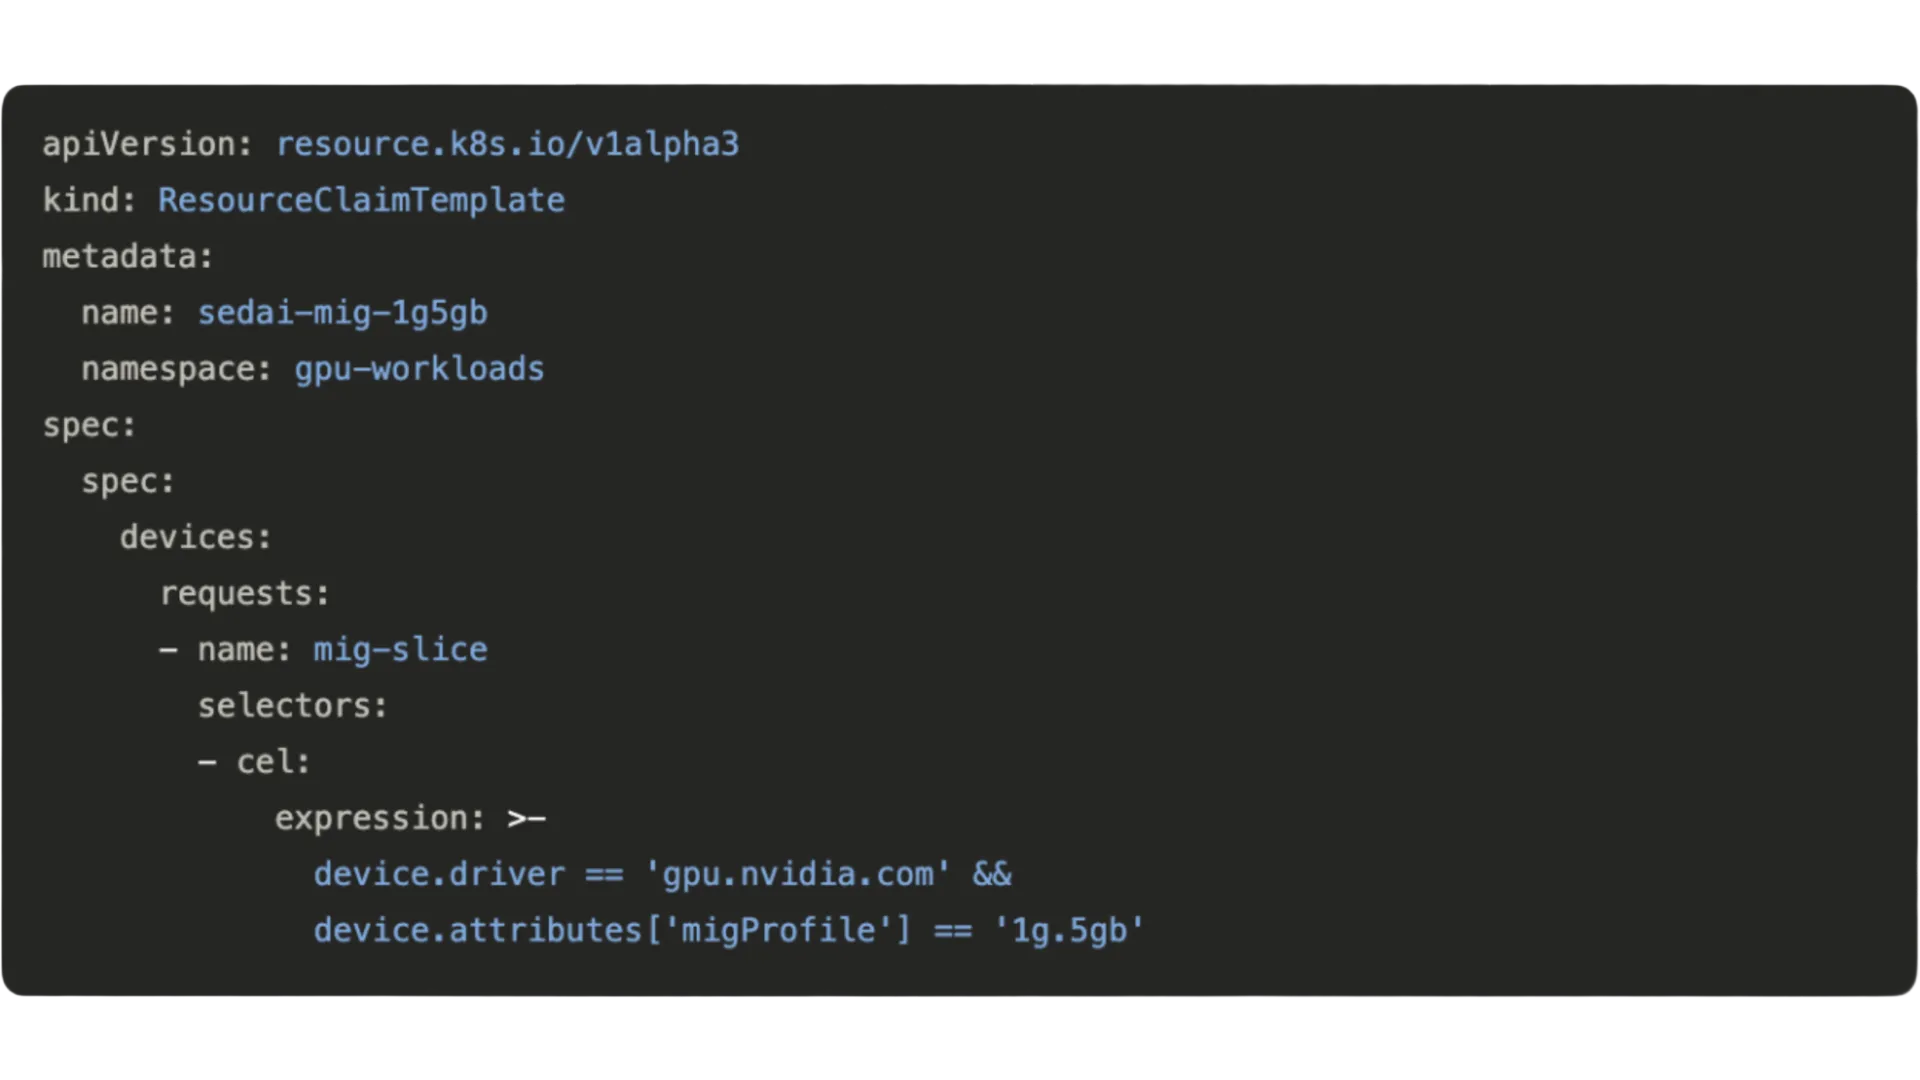
Sedai creates a ResourceClaimTemplate. Defines the MIG profile Sedai selected for the workload class.
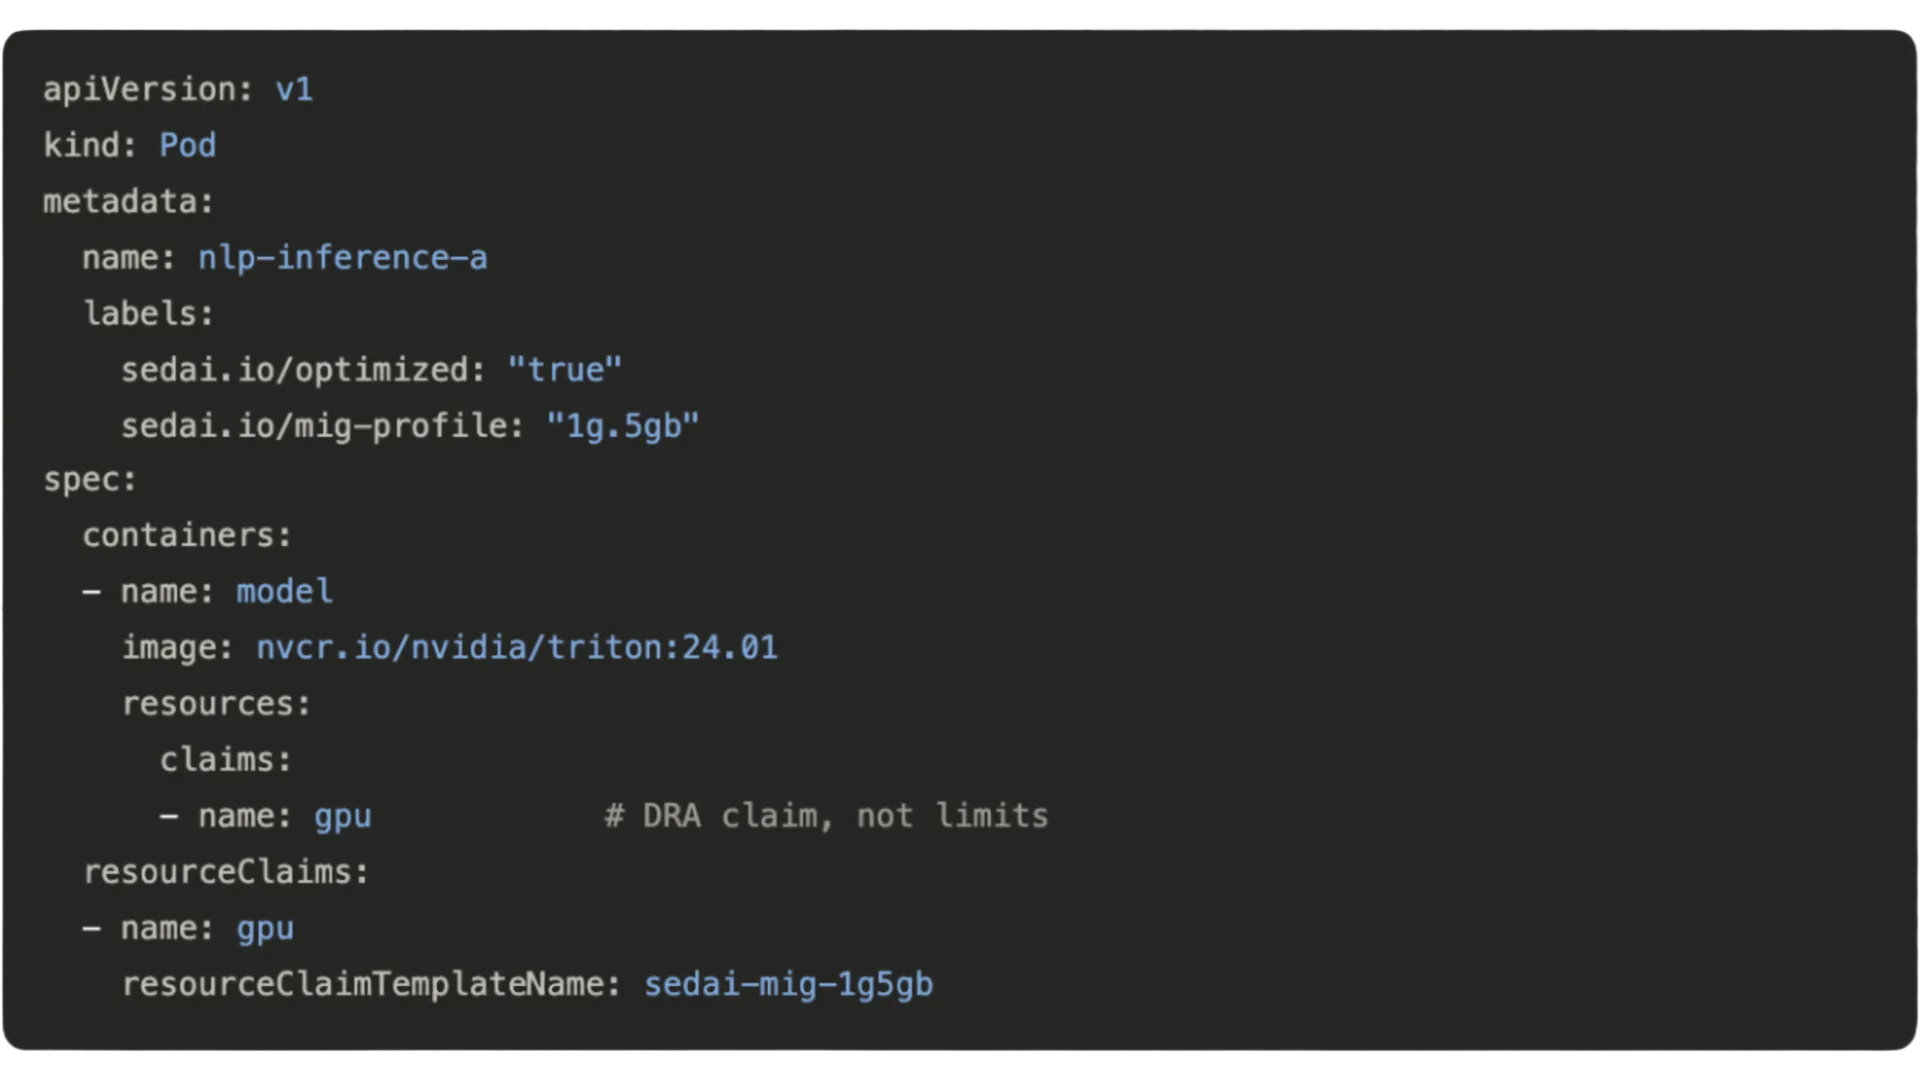
Sedai patches each pod to claim a slice. Workload pods reference the template via resourceClaims instead of traditional resource limits.
Resulting GPU layout. Sedai packs three inference workloads onto one A100. Four slices remain for future pods.
AWS fractional GPU instances (G6F) handle partitioning at the hypervisor level rather than requiring MIG configuration. Memory is fully isolated, but compute is time-sliced. It's a different model than MIG but solves a similar problem. Sedai supports both.
What's Still Unsolved in GPU Optimization
We figured out a lot when it comes to GPU optimization, but in these early stages of the GPU boom, there’s still more to solve.
MIG partitions are static. You define them in advance and they stay fixed, but traffic isn't. A workload at noon looks different from the same workload at 2am.
The next problem is dynamic GPU partitioning, where MIG slices expand & contract automatically based on actual traffic, the same way CPU & memory resources already scale in Kubernetes.
The tooling to do this at the hardware level doesn't exist yet. DRA gets closer, but it's still not production ready. Until it is, partition configurations have to be defined upfront & managed manually when workload patterns shift.
Beyond partitioning, the broader challenge is that GPU infrastructure is still maturing fast. New hardware generations, new ML frameworks, & new Kubernetes primitives are all moving simultaneously. What works today may need to be rebuilt for the next generation of hardware.
The measurement problem we solved for A100s and H100s will need to be revalidated for whatever comes next.
If you want to learn more about how Sedai autonomously optimizes Kubernetes GPU workloads in production, Ethan's post on the GPU Optimization launch covers what we built and how it works.
Sedai's GPU optimization is available now. Stop guessing at GPU utilization; schedule a demo to see how.
FAQ
What is GPU optimization in Kubernetes?
GPU optimization in Kubernetes improves GPU utilization, workload scheduling, and infrastructure efficiency for AI and ML workloads. It helps reduce idle resources while maintaining application performance and scalability.
Which is best for Kubernetes GPU optimization: manual management or autonomous optimization?
Manual GPU management becomes difficult as Kubernetes environments scale and workload patterns change frequently. Autonomous optimization continuously adjusts GPU allocation and scheduling in real time to improve efficiency.
How does GPU optimization work in Kubernetes?
GPU optimization in Kubernetes works by analyzing workload demand, GPU utilization, and scheduling behavior to improve resource allocation. Techniques like GPU partitioning and dynamic scaling help maximize infrastructure efficiency.
How does Sedai help optimize Kubernetes GPU workloads?
Sedai autonomously optimizes Kubernetes GPU workloads by continuously tuning GPU allocation, scaling behavior, and node utilization in real time. It helps teams achieve up to 30% cloud savings with a 5-minute agentless setup.


.webp%3Fv%3D2026-04-09T18%253A41%253A05.143Z&w=3840&q=75)